Every meaningful AI model trained this year runs on hardware that passed through ’s fabs.
While investor attention has rotated toward memory and CPU suppliers, the foundry that enables them all trades at a discount to its semiconductor index peers.
|
$414.15 TSM Close May 8, 2026 |
$420.00 52-Wk High NYSE ADR |
+130% 1-Year Return vs. SOX +41% |
$35.9B Q1 2026 Rev. +40.6% YoY (USD) |
66.2% Q1 Gross Margin +7.4 ppts YoY |
21x Fwd. P/E (TSM) SOX avg. ~26x |
>30% 2026 Rev. Growth Mgmt. guidance |
57.0 RSI(14) Neutral territory |
AI Infrastructure Thesis
The four largest U.S. hyperscalers (, , , and ) collectively plan approximately $725 billion in capital expenditure this year, with a significant portion directed at AI infrastructure and custom silicon. TSMC sits at the manufacturing chokepoint for that spending: Nvidia’s H100, H200, and Blackwell-series processors are fabricated on TSMC’s advanced nodes, and Apple’s current A-series and M-series chips rely on 3nm capacity that TSMC operates without credible competition at scale. The company is not an indirect AI beneficiary. It is the factory floor on which AI hardware is built.
Demand visibility is unusually high for a foundry business. Nvidia’s (NASDAQ:) disclosed purchase obligations to TSMC exceeded $95 billion as of the most recent filing, compared with approximately $16 billion two years prior. Long-term customer commitments of that scale, combined with significant prepayment arrangements from multiple customers, create a revenue floor that operates with greater stability than the cyclical wafer demand that has historically defined foundry economics. TSMC’s AI accelerator revenue CAGR target of 54%–56% through 2029, disclosed on the Q1 2026 earnings call, reflects internal modeling from committed order flow, not speculative demand extrapolation.
Technical Snapshot
|
Price (May 8, 2026) |
$414.15 | Intraday range $408.11–$420.00 |
|
52-Week Range |
$176.47–$420.00 (confirmed NYSE intraday high) |
|
SMA 20 (chart) |
$415.95 | trading near 20-day average |
|
SMA 50 (chart) |
$396.32 | post-earnings support reference |
|
SMA 100 (chart) |
$369.16 | structural trend floor |
|
Support Zone |
$395–$402 (pre-earnings resistance, now support) |
|
Resistance Zone |
$418–$422 (May 2026 intraday session highs) |
|
RSI(14) |
57.0 | neutral, no overbought signal present |
|
Volume (May 8) |
Approximately 13.5M shares, near 30-day average |
|
Pattern |
Post-earnings range consolidation below 52-week high |

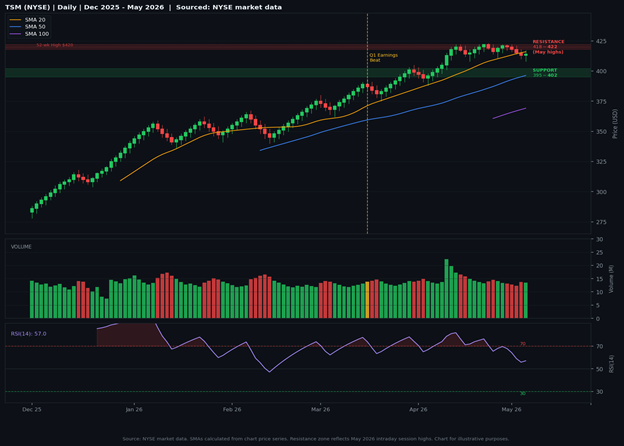
Figure 1: TSM (NYSE) daily, December 2025 to May 8, 2026. SMA 20 (amber), SMA 50 (blue), SMA 100 (purple). Resistance zone at $418–$422 reflects May 2026 intraday session highs. Dashed yellow line: Q1 2026 earnings release (April 16, 2026). Source: NYSE market data.
TSM has entered a post-earnings consolidation phase immediately below its 52-week high of $420.00, a structure consistent with institutional absorption rather than distribution. The stock closed May 8 at $414.15, trading within a range defined by support near $395–$402, the level from which the April 16 earnings-driven advance originated, and resistance in the $418–$422 band corresponding to May 2026 intraday session highs. RSI(14) at 57.0 reflects neutral momentum: the overbought reading generated around the earnings catalyst has dissipated without producing the negative RSI divergence that would signal deteriorating trend structure.
Price holds above all three chart SMAs: the 20-day at $415.95, the 50-day at $396.32, and the 100-day at $369.16. The constructive alignment, with price consolidating near the 20-day average while the 50-day sits approximately $18 below, reflects a stock digesting a sharp re-rating rather than reversing it. The $395–$402 support zone is structurally significant because it corresponds to the pre-earnings resistance cluster that converted to support on the April breakout. A sustained close below that zone would indicate the earnings catalyst has been fully absorbed and that new fundamental justification is required to extend higher. A decisive close above $422 on above-average volume would represent a breakout to uncharted territory.
Margin Expansion and Capex Execution
TSMC’s Q1 2026 results provided direct evidence of the operating leverage embedded in its cost structure. Gross margin expanded to 66.2% from 58.8% a year earlier, a 7.4 percentage-point improvement driven by higher factory utilization, cost efficiency programs, and a favorable technology mix. Advanced nodes (7nm and below) accounted for 74% of wafer revenue in the quarter, with 3nm contributing 25% and 5nm contributing 36%. Q1 revenue reached $35.9 billion, up 40.6% year-over-year in U.S. dollar terms, beating the prior guidance midpoint and extending TSMC’s streak of eight consecutive quarterly beats on consensus estimates.
Management guided Q2 2026 gross margin of 65.5%–67.5% against a revenue range of $39.0 billion to $40.2 billion, implying approximately 10% sequential growth. The margin guidance holds Q1 levels despite the anticipated ramp of N2 node capacity, which typically dilutes blended margins at early production volumes due to lower initial yields. Management subsequently revised long-term gross margin targets upward to above 56%, signaling that the current margin structure reflects a durable step-up rather than a peak. Full-year 2026 revenue growth guidance was raised to above 30% in U.S. dollar terms.
Capital expenditure guidance of $52 billion to $56 billion, with management indicating spending will likely reach the upper end of that range, supports N2 capacity expansion, Arizona Fab 21 Phase 2, and early N1.6 process development. Revenue growth materially outpaces investment growth: Q1 free cash flow reached NT$348 billion, and cash and marketable securities stood at approximately $106 billion at quarter end. The capex program is large in absolute terms but is funded from operations, not from external capital markets.
Revenue growing above 30%, gross margin at 66.2%, and Nvidia purchase commitments exceeding $95 billion suggest the revenue floor at TSMC is less cyclical than its semiconductor sector classification implies.
Valuation and Market Positioning
TSM trades at approximately 21x forward earnings, compared with a PHLX Semiconductor Sector Index average of approximately 26x. The discount persists despite a financial profile featuring above-30% revenue growth, 66% gross margins, and contracted demand from the largest AI chip designers, a combination that would ordinarily attract a premium multiple in the semiconductor space. Two factors sustain the discount: geopolitical concentration risk in Taiwan, and a historical classification as a cyclical foundry rather than a structural infrastructure provider.
The geopolitical risk is real and structurally embedded; it cannot be arbitraged away. What has shifted is the degree to which long-term customer commitments reduce the cyclicality argument. Foundry businesses have historically been valued on their exposure to inventory cycles, where end-market demand weakness flows directly into wafer order cancellations. TSMC’s current order book, anchored by Nvidia’s $95 billion in disclosed purchase obligations and multi-year capacity agreements across Apple, AMD, and other leading fabless customers, reduces that exposure in a way that is not fully reflected in the stock’s relative multiple. The analyst consensus 12-month average price target of approximately $416.67, based on six analyst ratings all at Buy or Strong Buy, sits close to current levels, suggesting the Street’s near-term models are already fully pricing Q2 delivery, leaving earnings upside as the path to multiple expansion.
Scenario Framework
|
Scenario |
Trigger / Signal |
Directional Bias |
|
Bearish |
Taiwan Strait geopolitical escalation; hyperscaler capex revision; N2 yield shortfall disclosed in Q2. Any of these may pressure TSM toward the $370–$395 range. |
Downward toward $370–$395 |
|
Base Case |
Q2 revenue tracks within the guided $39.0B–$40.2B range; gross margin sustains above 65%; no material geopolitical event. Consolidation continues in the $395–$422 range. |
Range-bound $395–$422 |
|
Bullish |
Q2 revenue exceeds guidance high end; full-year outlook raised above 35% growth; N2 margin trends toward corporate average ahead of schedule. Potential extension above the $422 May high. |
Extension above $422 |
What to Watch
The immediate catalyst is TSMC’s Q2 2026 earnings release, expected in mid-July. Revenue guidance of $39.0 billion to $40.2 billion represents approximately 10% sequential growth from Q1. The more informative variable may be gross margin: any sequential improvement relative to Q1’s 66.2% print would indicate that N2 ramp costs are tracking below initial estimates, with positive implications for the full-year margin trajectory. Given that Q1 revenue beat the high end of prior guidance, the base case assumes demand visibility remains strong enough to support at least in-line Q2 delivery.
The structural question is whether the market’s 21x forward multiple reflects an appropriate discount for geopolitical concentration or an underappreciation of TSMC’s infrastructure-like demand characteristics. If the consensus evolves toward pricing TSMC as a structural AI infrastructure provider rather than a cyclical chip manufacturer, the valuation gap relative to the broader semiconductor index may compress. The technical setup, with price consolidating near the 52-week high, neutral RSI, and all major chart averages below current levels, is consistent with institutional accumulation ahead of the next fundamental catalyst. The $395–$402 support zone and the $418–$422 resistance band define the near-term range; a break above $422 would require a reassessment of the upper boundary.
Disclaimer: This article is for informational purposes only and does not constitute investment advice, a solicitation, or a recommendation to buy or sell any security. All data sourced from public filings, company earnings releases, and market data providers as of May 8-11, 2026. Past performance is not indicative of future results. Readers should conduct their own due diligence and consult a qualified financial adviser before making investment decisions.
5 Stocks Our Experts Predict Could Double In the Next Year
By submitting your email, you'll also get a free pivot & flow membership. A free daily market overview. You can unsubscribe at any time.