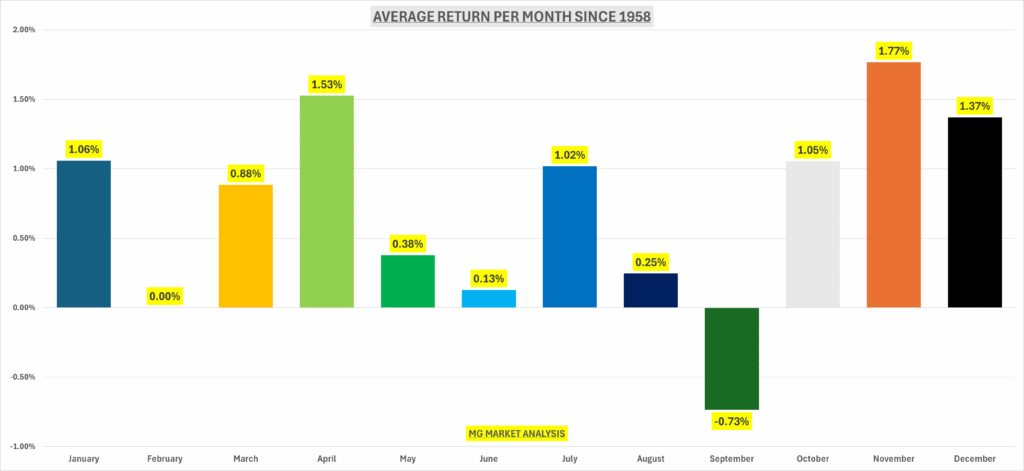
The old adage of “sell in May and go away” is rooted in fact. Since the index was constructed in 1958, the average returns for the May through September period haven’t been anything to brag about.
The average monthly return is 0.73%, which means every month, with the exception of July, has average returns that are well below the historical average. And the percentage of times these months close positive isn’t anything more than a coin flip.
However, a new pattern has emerged. 12 of the last 13 May’s have finished positive. And the average return by month over the last 10 years now shows the May through July period posting some of the strongest returns of the year, outside of November.
And it’s been quite consistent too. It’s not just been one or two big gains that skew the average return. May and June have closed positively in 9 of the last 10 years, and July has closed positively in each of the last 10 years.
What does this mean for investors? Unfortunately, not much by itself. It doesn’t tell whether this is just a reversion to the mean or the beginning of a new trend that is sustainable in the long term. Much of that will have to do with earnings growth and risk of recession in the near term.
Fortunately, it is looking pretty good on both fronts. Estimates for Q2 were revised up from 3.5% to 3.7% this week. PMI’s for both & were strong in April. While employment gains in April were slightly above expectations.
Total trade (imports + exports) is back to pre-liberation day highs as of the end of March 2026, after falling about 10% in response to the announcements and proceeding confusion.
This was a result of rising exports. A good sign for balancing the trade deficit. Total imports are still 9% lower than where they were a year ago, while total exports are making record highs, some 13.3% higher than they were a year ago.
Earnings growth continues to soar. Q1 EPS growth rose this week from 27.8% to 28.6%, now that 88% of the index has reported results.
Forward estimates continue to rise for the 15th straight week. Analysts are now expecting 21% EPS over the next 4 quarters. As a result, valuations have actually come down from where they were to start the year. Even as the index has made new all-time highs. We started the year at a forward PE of 23.2x, and now we stand at 21.3x. Still above the 5yr, 10yr, and historical average.
Resistance on the index was tested again this week. It’s still holding on but just barely.
The market-cap-weighted S&P 500 index continues to make new highs. The next stop is 7472.55 (purple dotted line above) which matches the average annual return for all years.
5 Stocks Our Experts Predict Could Double In the Next Year
By submitting your email, you'll also get a free pivot & flow membership. A free daily market overview. You can unsubscribe at any time.