At his May 3–4, 2026 shareholder meeting in Omaha, Warren Buffett described modern financial markets as a “church with a casino attached”, a characterization that landed with more analytical precision than philosophical flourish.
With the holding nearr 4.3% and speculative trading in zero-day options and leveraged ETFs reaching record volumes, the cost of owning hype over substance has become quantifiable in a way it simply was not during the near-zero rate era of 2020–2021.
Three metrics, EPS yield, free cash flow yield, and the yield spread against the risk-free rate, provide the framework to run the Warren Buffett casino test on any stock.
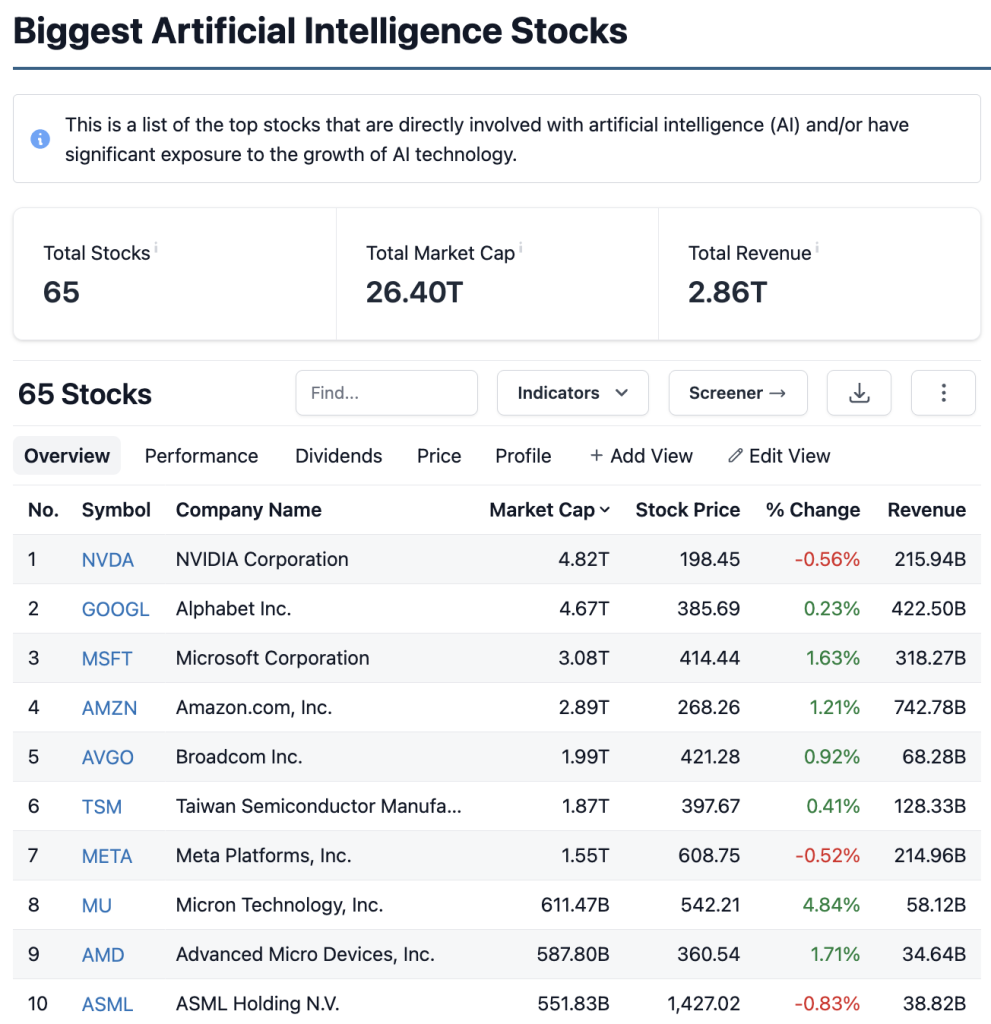
Applied to the AI and semiconductor sectors, currently attracting the heaviest speculative flows, they produce verdicts that are far less ambiguous than sentiment-driven narratives suggest.

The Warren Buffett Casino Floor: Why a High-Rate Environment Separates Investors from Gamblers
The warning from Warren Buffett is rooted in a mathematical principle. In a low-rate environment, the cost of capital is suppressed, allowing investors to justify paying high multiples for companies with delayed cash flows.
When the risk-free rate is low, future earnings have substantial present value. Conversely, at higher rates, the discounting of future cash flows becomes more aggressive, diminishing the value of speculative growth stocks and highlighting the disparity between companies that generate real returns and those that do not.
This is particularly evident in AI infrastructure and semiconductor equipment, where valuations surged through 2024 and into early 2025 amid strong demand projections. Companies like NVIDIA and exemplify the mix of genuine earnings and speculative premiums.
’s Q1 2026 results, showing a 39% rise in operating earnings driven by cash generation, emphasize that cash flow, not narrative, is what truly compounds.
Metric 1 – EPS Yield: The Earnings Test That Filters Out the Noise
EPS yield is calculated by dividing earnings per share (EPS) by the current share price, the inverse of the price-to-earnings ratio, and is expressed as a percentage.
This metric provides a comparable return figure. For example, a stock trading at 40x earnings has an EPS yield of 2.5%, while at 20x earnings, it yields 5.0%.
In the current environment, comparing EPS yield to the 10-year Treasury yield of 4.3% is crucial. If a stock’s EPS yield dips below this rate, investors are accepting a lower return for greater risk.
Thus, justifying the investment typically requires strong growth projections to elevate future EPS above this risk-free benchmark.
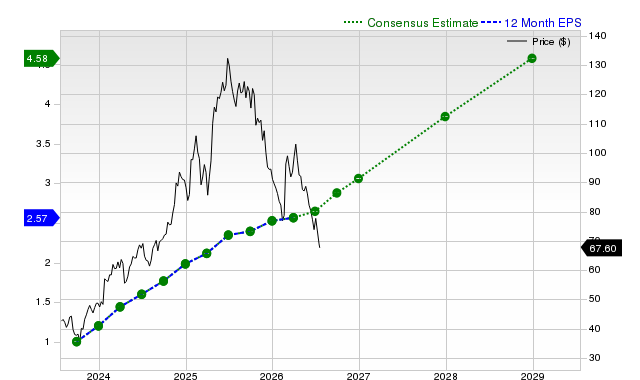
For instance, trades around $198 with a trailing EPS of $2.94, yielding about 2.7%, which is below the Treasury yield.
While forward EPS estimates for fiscal 2026 are $4.40, potentially raising the yield to 4.0%, this still does not fully match Treasuries. A stock must achieve a forward EPS yield of at least 4.3% to compensate for the added risks involved, per the Warren Buffett thesis.
Metric 2 – Free Cash Flow Yield: Why Earnings Aren’t Enough
EPS is an accounting measure, but free cash flow (FCF) reflects the cash left after a company covers its expenses and investments. FCF yield, calculated as FCF divided by market capitalization, often tells a different story than EPS.
In capital-intensive sectors like AI, there can be a significant gap between EPS and FCF. Companies investing heavily in areas like data centers may show modest or negative FCF while still reporting acceptable GAAP earnings.
While these periods can lead to future cash generation, relying solely on EPS can mislead investors about the valuation’s speculative nature.
For example, generated about $19.2Bn in FCF against a market cap of $1.9 trillion, yielding roughly 2.5%.
While below the 4.3% Treasury threshold, Broadcom’s diverse cash generation is fundamentally different from that of companies with negative FCF driven by speculative investments. Therefore, both EPS yield and FCF yield should be assessed together for a comprehensive valuation.
 Chart")
Metric 3 – The Yield Spread: Quantifying the Gap Between Risk and Reward
The yield spread measures the difference between a stock’s EPS or FCF yield and the current 10-year Treasury yield, reflecting the Warren Buffett casino test. A negative spread indicates a lower return per dollar than a risk-free asset, suggesting speculation rather than value investing.
With a 4.3% risk-free rate, stocks need an EPS yield of 5.5% to 6.5% to justify risk, translating to a P/E ceiling of about 15x to 18x. Many high-multiple stocks, particularly in AI and semiconductors, exceed this range.
For instance, , trading around $389 with an EPS yield of 4.97%, shows a positive spread of 67 basis points over the Treasury yield. In contrast, a pure-play AI company with a forward P/E of 60 has a forward EPS yield of just 1.67%, resulting in a negative spread of 263 basis points. This emphasizes the difference between speculative positions and genuine investments based on current returns.
***
Looking to start your trading day ahead of the curve?
Get up to speed before the bell with Bull Whisper—a sharp, daily premarket newsletter packed with key news, market-moving updates, and actionable insights for traders.
Start your day with an edge. Subscribe to Bull Whisper using this link.
5 Stocks Our Experts Predict Could Double In the Next Year
By submitting your email, you'll also get a free pivot & flow membership. A free daily market overview. You can unsubscribe at any time.