The Impact of Latest CPI Figures on Stock Market Sentiments and Rate Cut Expectations
The latest Consumer Price Index (CPI) figures unveiled today showcased a favorable trend in the ongoing battle against inflation.
The month-over-month CPI rise of 0.2% aligned with the Dow Jones consensus, lowering the year-over-year rate to 2.5% from the prior 2.9% surge.
Unexpectedly, core inflation witnessed a slight surge of 0.3% for the month, surpassing the 0.2% forecast, while the year-over-year figure stood at 3.2%, in line with expectations.
Notably, housing-related expenses portrayed a notable increase, with the shelter component of the CPI climbing 0.5% on a monthly basis and 5.2% year-over-year.
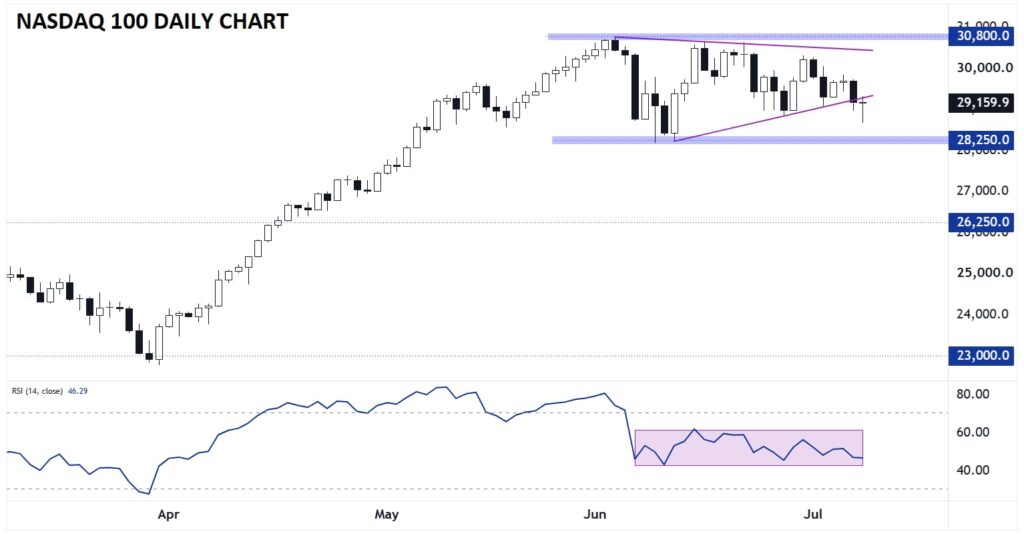
The initial market response included a considerable selloff, subsequently followed by a recovery with stocks rebounding post-lunch, with the Nasdaq even entering positive territory.
It seems Wall Street zoomed in on the monthly upswing in core inflation, dampening hopes for a significant 50-basis-point rate cut next week.
Parsing Through Market Behavior and Historical Data to Decipher Rate Cut Implications
The market’s reaction today, while dramatic, may lack an understanding of pertinent historical data.
Despite the query on the magnitude of the rate cut next week, there is a high probability of a rate reduction, with debates revolving around the rate size and the Federal Reserve’s future rate cut intentions.
Today’s sell-off indicated Wall Street’s inclination towards a 50-basis-point cut, driven by the belief that more substantial cuts equate to enhanced market performance. However, historical data suggests otherwise.
Conducting an analysis, the findings indicate that backing a 25-basis-point cut is beneficial for investors, showcasing superior market performance over time compared to more aggressive rate cuts.
Illustratively, studying the S&P’s performance post rate-cutting cycles reveals that gradual, measured cuts significantly outperform rapid, significant cuts in the long run.
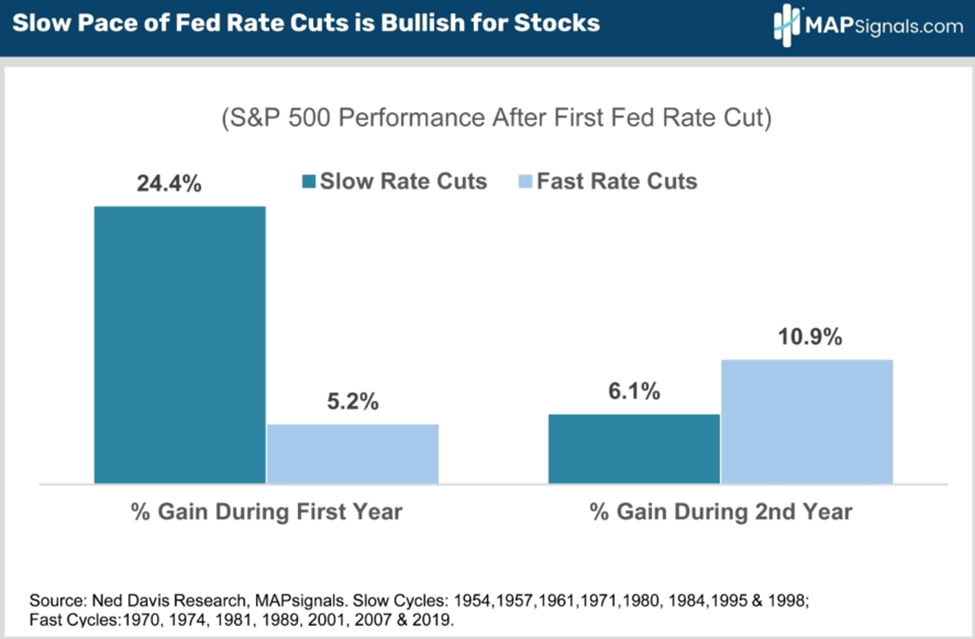
This analysis underscores the importance of meticulous rate adjustments for sustained market growth, emphasizing the prominence of a 25-basis-point cut for market stability and continued economic progress.
A Fresh Perspective on Investment Strategies: Prioritizing Price Movements over Conventional Metrics
Shifting focus, it’s imperative to reassess traditional investment assumptions, challenging the efficacy of set market strategies.
Despite prevalent investment beliefs associating specific metrics like low P/E ratios or emerging trends with financial success, the market reality often defies these conventional paradigms.
Market outcomes are not always in sync with anticipated results, highlighting the unpredictability of stock performance based on predefined metrics.
The bedrock of successful investing lies in stock price fluctuations during the investor’s tenure, transcending theoretical market approaches and emphasizing the tangible impact of price movements on wealth accumulation.
Ultimately, the core tenet of investment success pivots on price dynamics, substantiating the age-old adage that “price is truth” in market evaluations and strategic decisions.
Rather than solely focusing on theoretical metrics, prioritizing price movements could pave the way for enhanced investment decisions and sustainable wealth creation in the volatile financial landscape.
Unveiling the Mysteries of Investment Wisdom Through Stage Analysis
If your stock is soaring on a well-defined trajectory, stick with it to reap profits. Conversely, if it’s plunging or stagnating in a clear pattern, steer clear – no matter what other metrics suggest. Remember, price is the ultimate truth.
The fate of your retirement fund, your child’s education fund, or the dream of owning that lake house hinges on price action alone. So, ditch personal biases and focus solely on how the numbers dance.
The All-Seeing Eye of Stage Analysis
Your investment guru, Luke Lango, swears by a market framework known as “Stage Analysis.” Simplistic in concept, it boils down assets to three states: climbing, descending, or meandering horizontally. These states encompass four distinct stages: bottomed sideways, upward trajectory, topped sideways, or downward spiral.
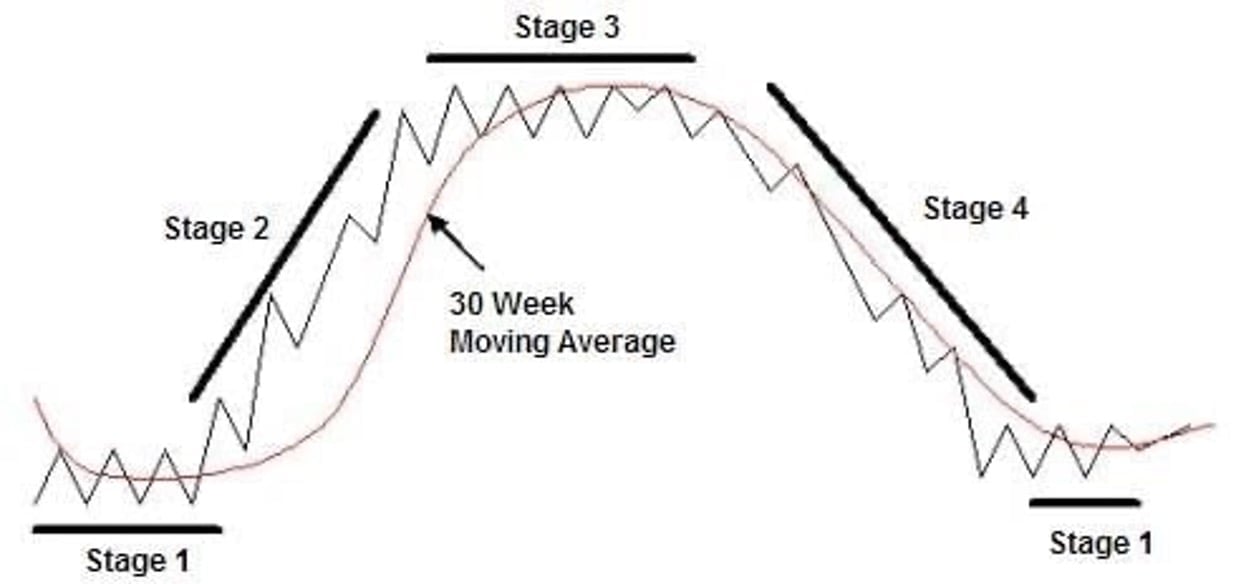
Stage analysis decodes which phase a stock inhabits and endorses investing only when it’s surging in Stage 2. This underscores the significance of price, the prime element steering your fortunes.
Luke’s mantra echoes this sentiment: “…The only thing that will make a difference to your portfolio is whether the stocks you own rise in value while you own them.”
Imagine stumbling upon a horrendous company – the antithesis of a blue-chip entity. Despite its cash bleed, abysmal management, and obsolescent industry, what if its stock suddenly skyrockets from $5 to $10? Would those flaws matter if it boosted your wealth? Not in the slightest. What counts is the stock’s ascendancy during your ownership for wealth’s sake.
Embracing the Price Paradigm
This obsession with price eliminates the need to prophesy interest rate revisions or succumb to personal biases. Instead, it hinges on interpreting an asset’s veracity reflected through price movements and responding judiciously.
Our discourse today skims numerous facets owing to spatial constraints in this journal. How can you accurately pinpoint Stage 2? Which timeframe is optimal for such assessments? What telltale indicators illuminate the various stages? How can you shield yourself from misdiagnosing a stage?
Join Luke tonight at 8 PM EST for the “Great Tech Reversal of 2024” event. Delving into a seismic market shift brimming with opportunities, Luke advocates employing Stage Analysis for navigating through uncharted waters.
Expect a stimulating evening of market insights, portfolio strategies, and a deeper dive into stage analysis. Secure your spot now and gear up for an enlightening session this evening.
Wishing you a pleasant evening,
Jeff Remsburg
5 Stocks Our Experts Predict Could Double In the Next Year
By submitting your email, you'll also get a free pivot & flow membership. A free daily market overview. You can unsubscribe at any time.