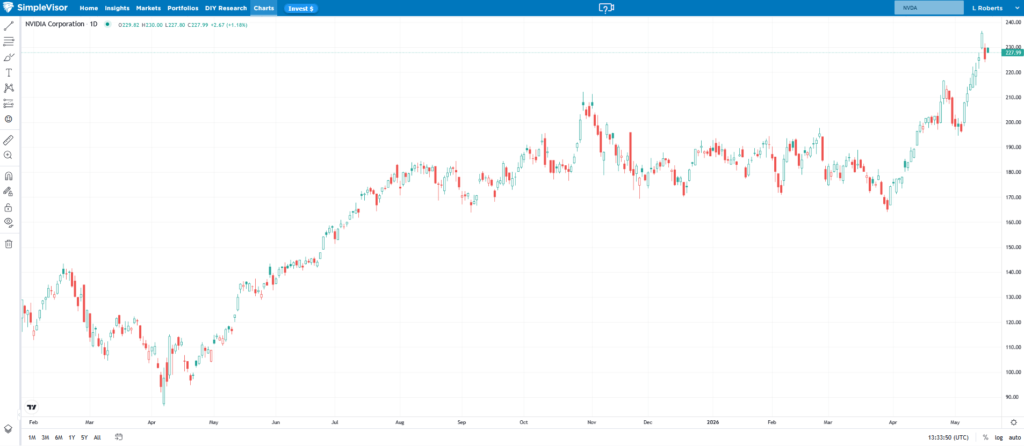
As we wrote in , the broad market indexes have surged since the April lows, driven largely by a handful of technology and AI stocks and the benefit of massive options volumes. Among the leaders is Nvidia (NASDAQ:), climbing nearly 40% from the April lows. Tomorrow, NVDA reports earnings, which, given its leadership role and massive market cap, could spark volatility in the stock as well as in many of the technology stocks that have driven the strong bullish uptrend.
The bullish case is well discussed in the media. AI infrastructure spending from the hyperscalers (, , , and ) remains robust, and NVDA’s data center revenue will consistently exceed expectations. As is the norm with NVDA, they will likely beat expectations, and the market’s primary focus will be on their forward guidance.
However, there are a few factors that could result in a negative outcome:
Rates are rising. The is now above 5.00%. High interest rates compress the multiples that help justify NVDA’s valuation. A strong earnings report may not be enough if the rate backdrop continues to deteriorate.
The Gamma setup is extreme. As we noted in yesterday’s Commentary, gamma exposure has surged to one of the highest levels since 2021. A disappointment from NVDA could trigger an unwind of the gamma squeeze.
Expectations are high. Semiconductor stock prices are likely getting ahead of their future earnings. Earnings and guidance beats are getting harder to hit, and the bar is rising with every quarter.
Micron And Johnson & Johnson: Will The Rotation Reverse?
Over the last month, Micron (NASDAQ:) has risen by nearly 70%, while Johnson & Johnson (NYSE:) is down about 2%. The graphic below looks at the Momentum factor ETF () and two of its top ten holdings to better highlight how extreme the growth-value rotation has been.
The graph on the right shows that over the last six weeks, MU has moved from slightly oversold on an absolute basis and from fair value relative to the S&P 500, to grossly overbought on both metrics. At the same time, JNJ moved from slightly overbought on an absolute and relative basis to fair value on an absolute basis but slightly overbought on a relative one.
So, as we contemplate how this period of bad breadth, marked by high sector dispersion, may play out, this graph offers a possible answer. The value stocks of the world, like JNJ, may be due for outperformance, while the high-flying technology companies, like MU, are due for relative underperformance.
From a macro perspective, the question is whether this likely growth-to-value rotation occurs in a down market, or whether the market remains stable as value sectors compensate for weaker technology stocks.
Tweet of the Day

5 Stocks Our Experts Predict Could Double In the Next Year
By submitting your email, you'll also get a free pivot & flow membership. A free daily market overview. You can unsubscribe at any time.