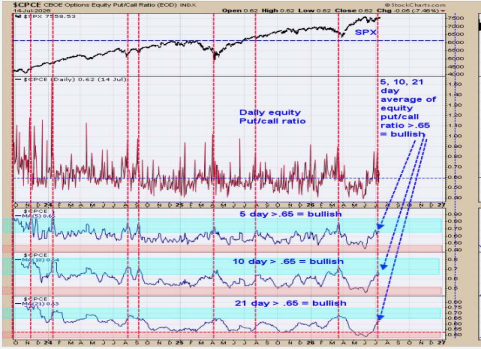
The chart above goes back three years. The bottom window is the 21 day average of the Equity put call ratio (CPCE); next higher window is the 10 day average and next higher is the 5 day average.

We noted with red dotted lines the times when all three moving averages of the CPCE reached near .65 and higher and in all cases the market was near a low or in a rally.

Above is a trending following method for the . The bottom window is the weekly SPX/ ratio and the middle window is the weekly SPX. Referring to the weekly SPX/VIX; we shaded in green and pink when the SPX/VIX ratio was below its mid-Bollinger band. We shaded in green when only the weekly SPX/VIX ratio was below its mid Bollinger band and shaded in pink when both the weekly SPX and SPX/VIX were below their mid Bollinger band. The SPX/VIX ratio usually leads the SPX. So when the weekly SPX/VIX ratio falls below its mid Bollinger band this condition can lead to the SPX falling below its mid Bollinger band which in turn can lead to a sell signal in the SPX. To get a sell signal both the weekly SPX/VXI ratio and weekly SPX need to fall below their mid Bollinger; which we shaded in pink. Right now, both the weekly SPX/VIX and weekly SPX are both above their mid Bollinger suggesting uptrend in SPX is intact.

The pattern forming on weekly appears to be a “Falling Wedge” This pattern has decreasing volume and the market works lower and the trend lines connecting the highs and lows verge into an Apex. The minimum upside target of the “Falling Wedge” is where the pattern began which is the March high near 117.00 range. Normally the rally out of the Apex is swift. GDX is near the Apex now. The bottom window is the weekly GDX/ ratio. This ratio is making higher lows and higher highs while GDX is making lower low and lower highs which in turn are a bullish divergence. Strong retracement rally in GDX is nearing.
***
Signals are provided as general information only and are not investment recommendations. You are responsible for your own
investment decisions. Past performance does not guarantee future performance. Opinions are based on historical research and data are believed reliable; there is no guarantee results will be profitable. Not responsible for errors or omissions. I may invest in the vehicles mentioned above.
5 Stocks Our Experts Predict Could Double In the Next Year
By submitting your email, you'll also get a free pivot & flow membership. A free daily market overview. You can unsubscribe at any time.