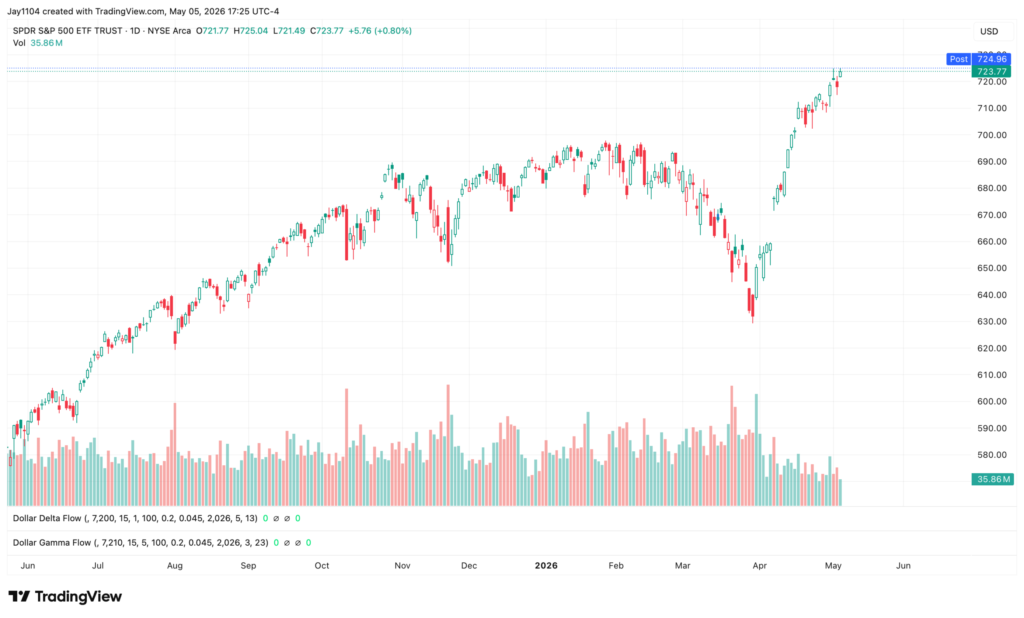
volume on Tuesday was lower than on the day after Thanksgiving. At least based on the data I have, the total volume was just 35.9 million shares. Christmas Eve, a half day, saw 39.5 million shares traded, Friday, November 28, a half day saw 49.2 million shares, and even July 3 saw 51 million shares traded. The only day that saw lower volume, from what I can see, was April 27, with 33.1 million.
Hard to say where it has gone, but options volume hasn’t really increased meaningfully, so it hasn’t gone there. So I don’t know, it is strange.
Volatility from a standpoint appears to be bottoming out, and that ratio between oil vol and the VIX remains very wide at more than 4.
What is odd about this whole thing, regarding volatility, is that the ratio between and volatility is not nearly as wide. In fact, the ratio of oil to gold is only 2.8, so why do gold and oil have a historically aligned ratio, but the and oil do not?
Clearly, oil and gold vol are elevated, and S&P 500 vol is not.
I can also say that, even more recently, the has started to push higher, while S&P 500 volatility has been falling.
It is the same when you look at the relationship between SPY and , which is a good enough indicator of the relationship between the equity and credit markets.
You can just look at the top movers to see that Tuesday’s index rise was mostly driven by semis, with Micron (NASDAQ:), Intel (NASDAQ:), Broadcom (NASDAQ:), Advanced Micro Devices (NASDAQ:), Lam Research (NASDAQ:), and Qualcomm (NASDAQ:) among the top 10 movers by weighting. This tells you a lot about how the moves are made up and why things are being separated and moving apart from one another.
We have also seen what is likely to be the peak in dispersion, and so my sense is that all of the divergence will converge at some point; which way they converge is another question.
5 Stocks Our Experts Predict Could Double In the Next Year
By submitting your email, you'll also get a free pivot & flow membership. A free daily market overview. You can unsubscribe at any time.