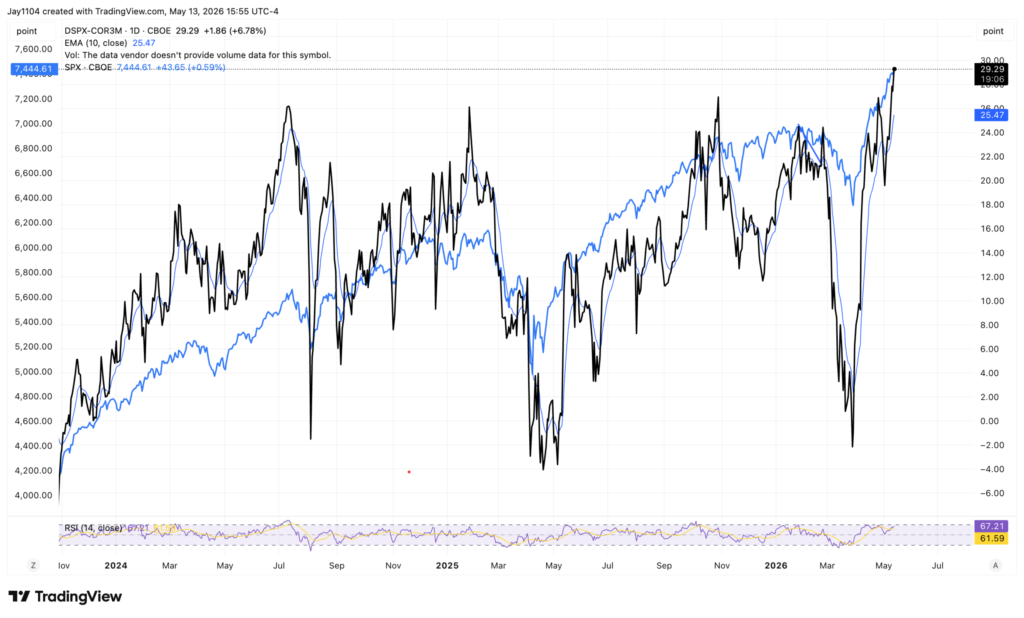
Dispersion continues to run very hot in the market, with the S&P Dispersion Index rising to nearly 41 and the 3-month Implied Correlation Index falling below 12. The spread between the two has climbed to a new all-time high of 29, which is notable because mega-cap earnings are essentially behind us, with the exception of NVIDIA (NASDAQ:).
Under normal circumstances, this trade likely should have peaked a few weeks ago. However, with NVIDIA reporting results next week, the trade may finally be nearing its conclusion.
Ultimately, what appears to be driving this dispersion is that, rather than continuing to decline, implied volatility in the is actually rising. That means the average implied volatility for S&P 500 stocks is rising. Because the is not rising, or at least not rising as quickly, it is creating a wider gap in implied dispersion.
One thing that stands out at this point is that 21-day realized volatility is 9.8, while the is at 17.9. To me, that implies traders are betting that volatility will eventually return.
NVIDIA earnings next week could play a major role in this cycle, as we know that after NVIDIA reports, its implied volatility will likely fall sharply, which should help push dispersion lower.
For now, it is a tale of two markets. The technology sector is leading the S&P 500 by 19 percentage points, and every other sector is underperforming. In fact, the energy sector is underperforming the S&P 500 by 20 percentage points. Ironic, isn’t it?
Let us not forget that today is also a settlement day, and, based on what we saw on Tuesday, a weak trading day today would not be a surprise.
5 Stocks Our Experts Predict Could Double In the Next Year
By submitting your email, you'll also get a free pivot & flow membership. A free daily market overview. You can unsubscribe at any time.