We meticulously analyze the S&P 500 (SPX) using the Elliott Wave Principle (EWP), seen through the lens of historical price patterns. In our recent evaluation, we projected an upward impulse wave targeting the $5427-53 range, stemming from a specific Fibonacci-based impulse model.
However, the index veered off the anticipated path, entering a sideways phase for eleven consecutive trading days. Contrary to the expected standard Fibonacci dynamics, a deviation in the market behavior surfaced.
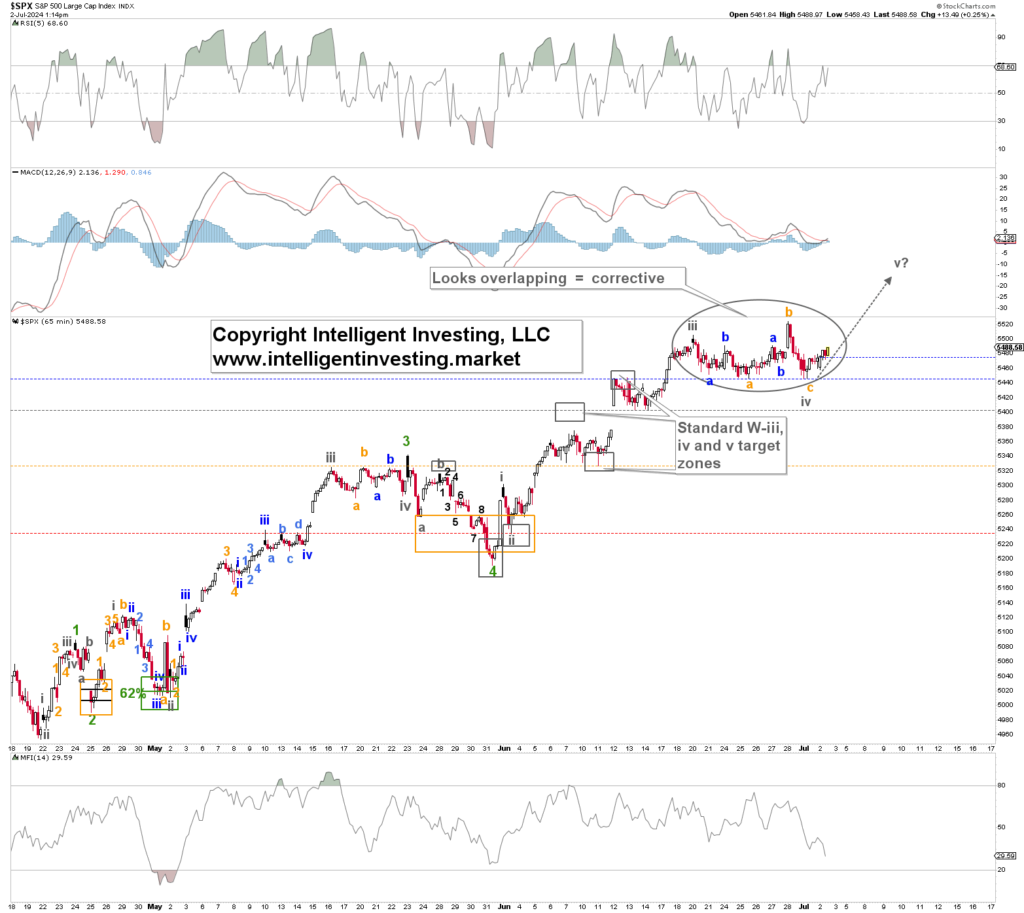
This deviation alerted market observers to a potential scenario introduced in an earlier update, highlighting the possibility of a corrective sequence within the rally. This adjustment could entail a minor pullback around the $5260 level, followed by an additional push towards the $5550 range. A noteworthy signal would emerge if the index breached the $5427-53 zone, signaling a more substantial correction.
Our analysis incorporates critical price thresholds, depicted by colored dotted lines on Figure 1, acting as cautionary benchmarks for bullish investors. These markers serve as stop-loss levels, with the orange line at $5325 indicating a pivotal level. A breach of this mark would strongly suggest an impending correction.
Furthermore, the daily McClellan Summation Index (SPXSI), a gauge of market breadth, exhibits signs of being oversold, as illustrated in Figure 2. This oversold condition often precedes corrective moves, hinting at a potential upward trajectory. Market breadth improvement historically correlates with rising index values, emphasizing the likelihood of a bullish momentum shift.
Delving into seasonal trends, a historical analysis focusing on US Presidential Election Years, as depicted in Figure 3, unveils patterns in market behavior. Typically, late June marks a pivotal low, with July indicating consolidation and August heralding significant market movements.
However, it’s crucial to note the nuanced nature of historical averages, as they are not definitive indicators but rather guiding principles for market observation. Recent market fluctuations have aligned with the historical trend, culminating in a recent market bottom.
In summary, while certain indicators suggest an upward trajectory, price action remains the ultimate decider in market trends. Despite lingering bearish sentiment, the bulls have managed to defend critical support levels, with the index’s ability to sustain levels above $5400 and particularly $5325 serving as a testament to current bullish resilience.