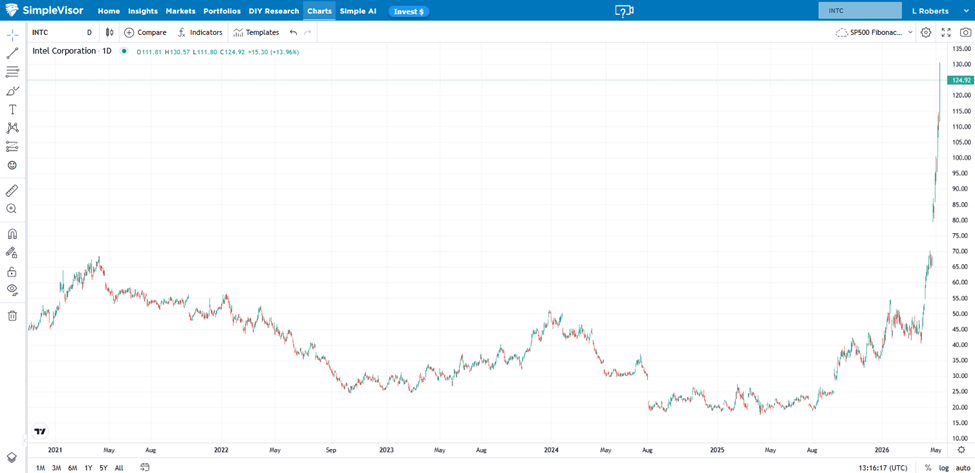
Intel (NASDAQ:) shares have risen nearly 90% over the past month and more than 200% since the start of the year. Its competitors, Advanced Micro Devices (NASDAQ:) and Micron (NASDAQ:), are posting similar gains. Many other semiconductor stocks, along with some computer hardware companies, are the market’s latest AI darlings. Momentum and gamma are driving the outperformance, and, in their wake, a supportive narrative is trying to justify it.
The narrative holds that the insatiable infrastructure buildout for AI, including data centers, GPUs/CPUs, networking equipment, and power grids, requires massive capital expenditure from the largest hyperscalers (, , , and ). The suppliers of these products, including semiconductor and hardware producers, are the most direct beneficiaries.
AI will significantly improve the bottom line for many companies. But investors should be asking whether the stock prices have gotten too far ahead of fundamentals. The answer, in our opinion, is likely yes. As we wrote in :
Here’s the part that should bother bulls the most. SOXX is trading at multiples that already reflect strong 2026 earnings. The current rally has likely already fully priced in 2026 earnings. From here, you are paying for 2027 and 2028 growth in a sector where the cycle has not been repealed. Semiconductors are still cyclical. Always have been. The day the AI capex cycle hiccups, even briefly, is the day this chart breaks.
To fully appreciate the recent astonishing performance, it’s worth looking beyond fundamentals and narratives to better understand how herding, momentum, and option delta and gamma can systematically drive prices higher and eventually lower.
Momentum Creates Momentum
Financial momentum is the tendency for assets that have been rising to continue rising and those that have been falling to continue falling. Often, during a strong momentum phase, the pace of buying or selling increases, resulting in parabolic price gains, as we are witnessing with Intel and its competitors.

When a stock trends higher, investors increasingly notice the bullish momentum and buy it, which pushes the price higher and attracts even more buyers. This type of herding behavior can create a self-reinforcing cycle- buying begets more buying.
When momentum is strong, the pressure on new investors to join the trade or on existing ones to add to their positions is enormous. As these investors focus on the incredible rewards they might receive, they often lose sight of the trade’s fundamental justification. The result is a crowded trade with sometimes breathtaking gains, but ultimately a sharp reversal that strips profits from most participants.
Retail and institutional momentum traders often use call options as a leveraged way to participate in price gains without buying the stock outright. Call options provide investors with limited downside risk and the potential for upside gains that can be multiples of the underlying stock’s price. Call buying can become a momentum accelerant, as we explain next.
What Is Delta
To better appreciate how options, particularly calls, can boost stock prices, which in turn adds momentum and fuels the herding behavior of millions of investors, we need to understand some option basics.
We start with delta. Delta measures how much an option’s price changes for every $1 move in the underlying stock. For instance, a call option with a delta of 0.50 will gain roughly $0.50 in value for every $1.00 increase in the stock price. Importantly, delta changes as the stock price moves. As shown in the hypothetical graph below, delta rises as the option approaches its strike price and falls as it moves below it. The non-linear rate at which delta changes is called gamma.
Delta is affected not only by how far the stock price is from the option’s strike price but also by implied volatility and time to expiration. Other smaller factors include put/call skew, dividends, and interest rates.
Gamma
Gamma quantifies the curvature of delta (the green line in the graph above). It is the rate at which an option’s delta changes for every $1 move in the underlying stock. For example, if a call option has a delta of 0.50 and a gamma of 0.05, a $1 rise in the stock pushes the delta to 0.55, and another $1 gain pushes it to 0.60, and so on. Think of it this way: delta tells you how much the option price will move per change in the stock, while gamma tells you how fast that relationship will change.
Gamma is highest for options closest to expiration. Thus, the recent surge in the number of very short-term and same-day expiry options (0dte) is significantly impacting options brokers, as we will explain.
Delta Hedging Can Drive Momentum
When an investor buys a call option, someone must be selling it to them. Most often, market makers and brokers fill that role. Their financial interest in selling options is to make money regardless of what the option price does, not by taking the opposite position of the options buyer. They try to ensure profits by hedging.
Brokers hedge exposure by buying or selling shares of the underlying stock in proportion to the option’s delta. This process is called delta hedging.
Assume a broker sells an investor a call option with a delta of 0.50. The dealer will buy 50 shares of the stock for each option sold. If the delta suddenly jumps to 0.60, the dealer will buy 10 more shares. If the stock falls and the delta declines, the dealer will sell shares.
In isolation, this is simple hedging management that often has little impact on the markets. But when the options market becomes large enough relative to the stock market, this constant hedging activity itself begins to move prices. As they say, the tail is wagging the dog.
The graph below shows a sharp increase in call option trading over the past few years, resulting in significantly higher hedge-trading volume among option brokers.
Gamma Squeezes
The growing volumes in the options market, along with the popularity of very short-term and even same-day options, are intensifying broker hedge trading. At times, this heightened activity results in what is called a gamma squeeze. This occurs when a surge in call option buying forces hedgers to purchase shares at an accelerating rate, pushing the stock price higher. That higher price, in turn, forces hedgers to buy even more shares, pushing the price higher still. This reflexive loop can have a short-term, tremendous impact on the underlying stock price.
The conditions for a gamma squeeze typically require a few ingredients:
- a stock with relatively thin float.
- large buildup of near-the-money call options with short expiries.
- enough momentum to start the feedback loop.
Avis Budget Group (NASDAQ:) was the most recent example. CAR surged from roughly $150 in late March to nearly $850 in a matter of weeks before collapsing back to $150. Unlike semiconductor and hardware stocks, the gamma squeeze in CAR was more pronounced because its float was small and short interest was nearly 90%. That said, call option volumes spiked by roughly 10,000%, contributing to the surge in the stock price.
The Gamma Flip
If a gamma squeeze can set a stock price or market on fire, the gamma flip can pour water on it.
Dealers are never perfectly hedged. Thus, to quantify how their hedging activity might impact the market, it’s useful to know the degree to which they are over- or under-hedged. In market parlance, that is their net gamma position.
When dealers are net short gamma (they have sold more options than they have bought), they are forced to buy stocks when prices rise and sell when prices fall to stay hedged. Thus, when dealers collectively hold short-gamma positions, they have to chase the market; their hedging activities amplify price movements and volatility.
On the other hand, when dealers are net long gamma, the opposite occurs. They buy weakness and sell strength. Accordingly, these hedging activities serve as a natural market stabilizer, dampening volatility.
The gamma flip occurs at the price level where a dealer’s gamma exposure crosses from positive to negative territory, or vice versa. This level is calculated by options analytics firms and is increasingly closely watched by institutional traders. The gamma flip is something of an invisible gravitational boundary in the market.
The graph below, courtesy of Radar Options, shows that as of May 11, 2026, the Index is in a long-gamma position, supportive of an uptrend with reduced volatility. If it were to flip negative by falling below 7185, we should expect increased pressure for further downside and higher volatility.

Keep in mind the graph is for the S&P 500. Each individual stock has its own aggregate gamma exposure level, which can differ widely from the market.
Option Extremes
Dealer hedging is dynamic; thus, gamma exposure and flip levels are constantly in flux. The graph below, courtesy of ZeroHedge, shows that the volatility in dealers’ aggregate gamma positioning has been extreme recently. In just a six-week period, gamma exposure flipped from extremely short, which supported the rally from the late March lows, to one of the longest gamma positions on record.

The graphic below shows how extreme the rush into technology call options has been. The bottom-left graph shows that call skew on the () is the highest it’s been in over the past year. Call skew measures the extent to which out-of-the-money calls trade at higher implied volatility than at-the-money calls.
High skew reflects aggressive demand for upside calls, which drives up premiums on higher call strikes. High call skew is most common in individual momentum stocks and during gamma squeezes, when the options market prices in a higher probability of explosive upside than a normal distribution would suggest.
Bear in mind that the put skew is currently very low, signaling historically low demand for protection.

Summary
Options were traditionally used for risk management purposes. Yet their proliferation and widespread use by traders and gamblers have created a market structure that increasingly results in significant volatility and enormous price changes for entirely non-fundamental reasons. Thus, the risk management tool has become a market risk in and of itself.
As we have witnessed with CAR and are currently seeing with many technology stocks, a stock price can surge when a critical mass of investors generates a momentum signal, drawing in more investors and short-dated call buyers. Options brokers then feed the momentum as they are forced to buy as the stock price rises.
Similarly, as we also saw with CAR and will likely see with some semiconductor and hardware stocks, prices can drop sharply not because of fundamental developments, but simply because momentum gives way, gamma flips, and dealer hedging amplifies a modest decline into something more severe.
Sometimes stocks and markets completely ignore fundamentals and run higher on a self-reflexive loop. During these moments, prices get divorced from fundamentals, and individual stocks and/or markets can become fragile.
5 Stocks Our Experts Predict Could Double In the Next Year
By submitting your email, you'll also get a free pivot & flow membership. A free daily market overview. You can unsubscribe at any time.