Observing the Evolution of Markets
Last week’s subdued market atmosphere resembled watching paint dry; unexciting and lacking in action. However, a stark contrast emerges this week. “Meme” stocks like GameStop (GME) and AMC (AMC) surged following a tweet by internet personality “Roaring Kitty.” Concurrently, the Chinese equities market remains resilient with stocks like Alibaba (BABA) and Futu Holdings (FUTU) experiencing notable gains. Amid this whirlwind, investor anticipation heightens.
But the real excitement is yet to unfold…
Insights into the Economic Calendar
Aside from individual market frenzies, deciphering upcoming economic data releases and events stands crucial for investors.
Tuesday, May 14th: Producer Price Index (PPI) @ 8:30 am EST, Fed Chair Jerome Powell speaks @ 10:00 am EST
Wednesday, May 15th: Consumer Price Index (CPI), U.S. Retail Sales @ 8:30 am EST
Short-Term Market Prospects
Persistent inflation concerns have been a persistent obstacle for Jerome Powell and the Federal Reserve. Hence, bracing for heightened volatility in the week ahead is prudent. With the S&P 500 Index ETF (SPY) on a seven-session upward streak, a minor retreat wouldn’t be surprising. Historically, the month of May has seen the S&P 500 Index decline in 11 of the last 15 options expiration weeks for May, the current scenario included.
Intermediate/Long-Term Perspective
Navigating conflicting data across different timeframes is key for success in market analysis. The broader outlook over intermediate to long-term durations projects a more bullish trajectory.
The Put/Call Ratio
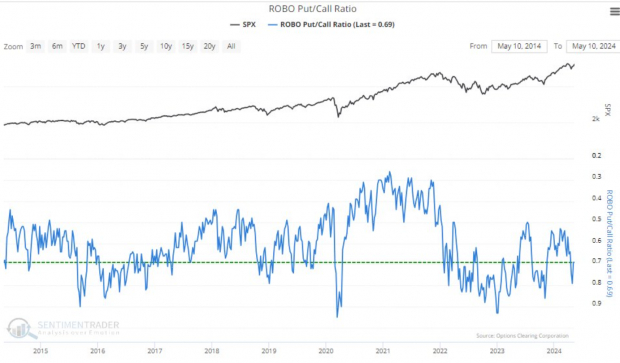
The put/call ratio serves as a barometer for market exuberance and retail sentiment. Despite intense movements in individual stocks, the put/call ratio hovers around normal levels, showing no signs of exuberance.
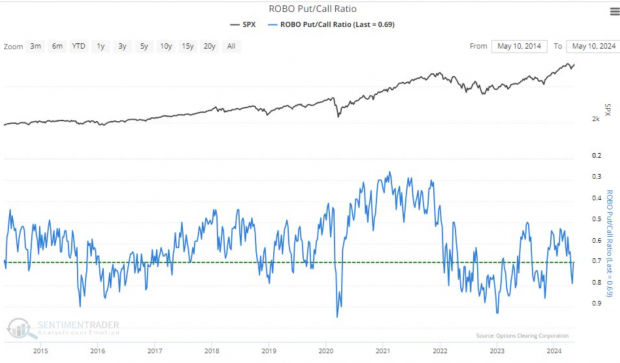
Image Source: Sentimentrader
Fear & Greed Index
The CNN Fear and Greed Index echoes the sentiment of the put/call ratio. Despite markets hovering near all-time peaks, the Index reflects a “Neutral” sentiment.
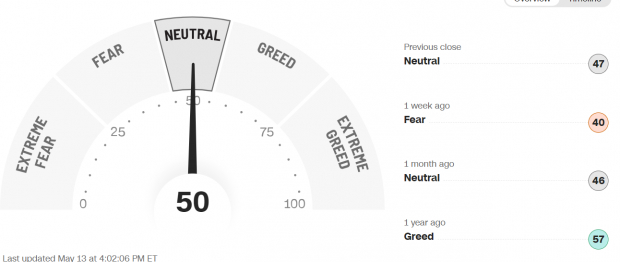
Image Source: CNN
Broad Market Participation
The Net New Highs Indicator reveals an uptrend in the number of stocks hitting fresh highs compared to lows, underscoring a widening participation as stocks ascend.
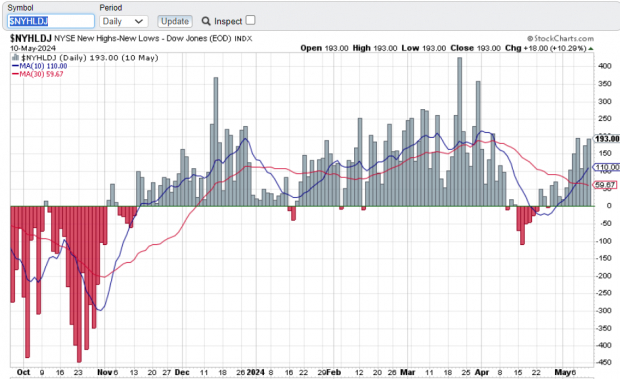
Image Source: Stockcharts.com
Key Takeaways
As investors ready themselves for impending economic data releases, prepare for short-term turbulence. While short-term forecasts hint at volatility, the medium to long-term outlook remains optimistic.

