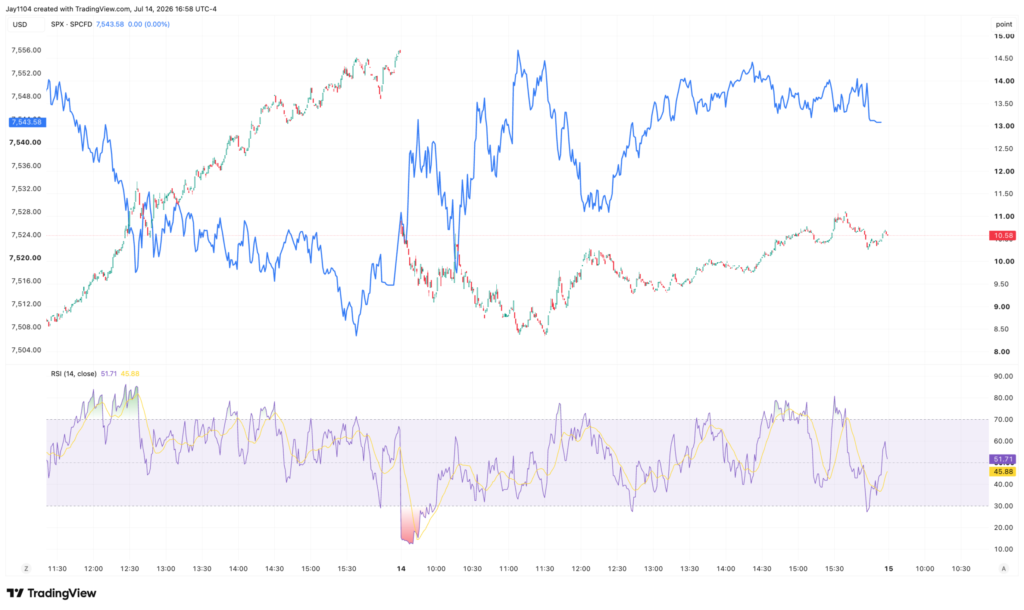
S&P 500/VIX Strength Suggests a Sell Signal Has Not Yet Formed
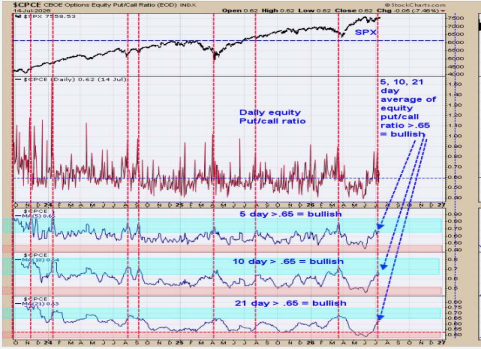
The chart above goes back three years. The bottom window is the 21 day average of the Equity put call ratio (CPCE); next higher window is the 10 day average and next higher is the 5 day average. We noted with red dotted lines the times when all three moving averages of the CPCE reached ...