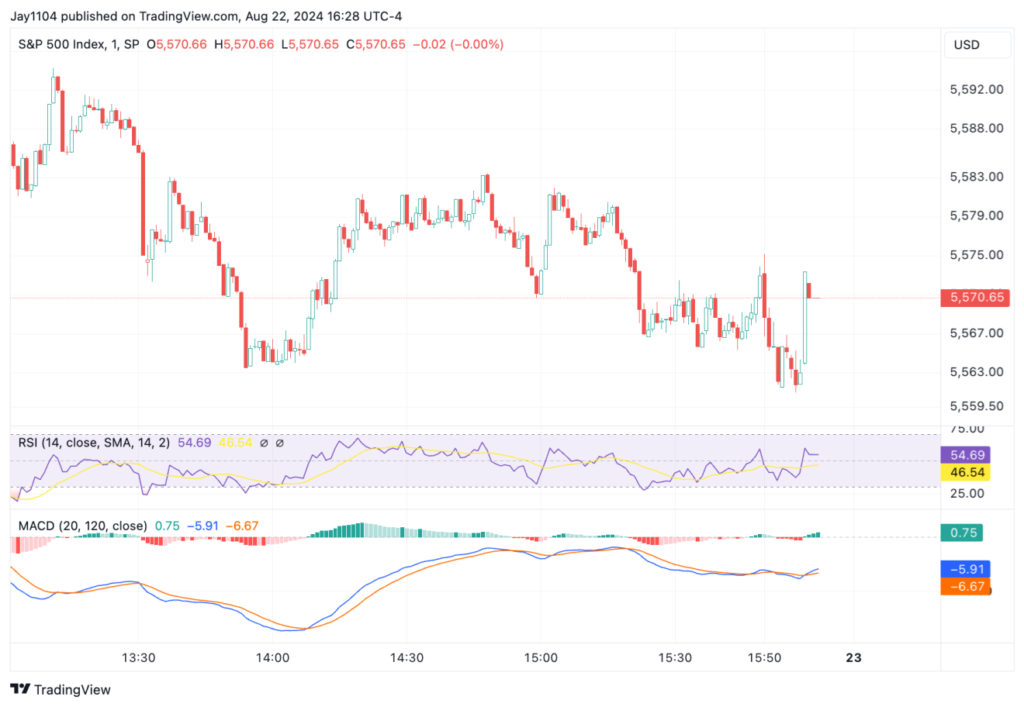
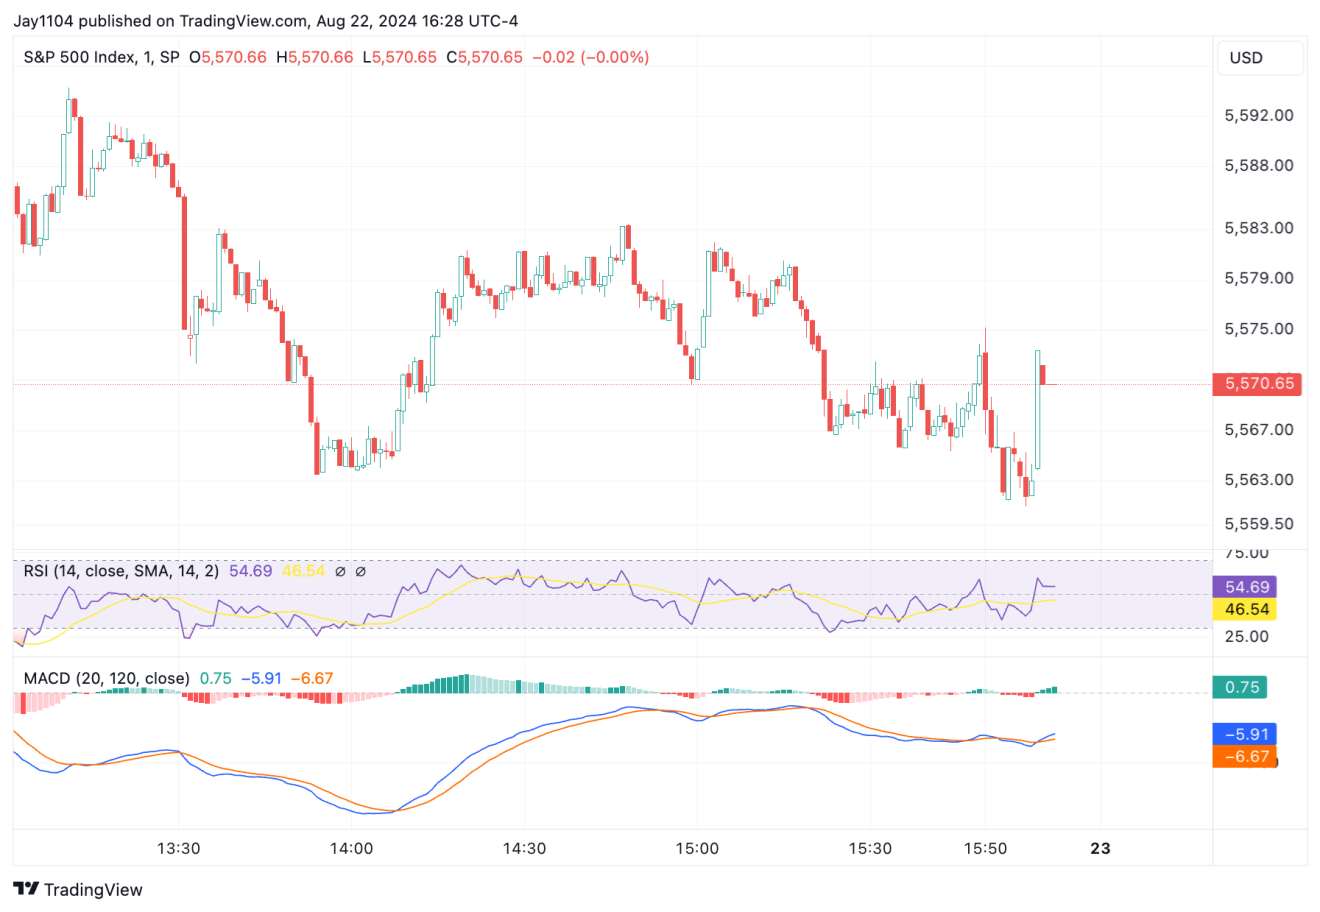
Stocks closed lower yesterday, with the S&P 500 falling by 89 basis points. The drop could have been steeper if not for a late 19 basis point rebound in a one-minute candle at 3:59 PM.
Market-on-close (MOC) orders yesterday were predominantly sell orders, and their size was unusually small—less than $1 billion. Typically, substantial buying or selling at the close indicates active systematic funds.
Yesterday’s smaller MOC raises questions. It’s the first time in a while we’ve seen such a minor close, suggesting a potential shift in systematic funds after yesterday’s decline.
Here are four key market signals traders should watch as Powell prepares to speak at Jackson Hole.
1. S&P 500 Breaks Channel
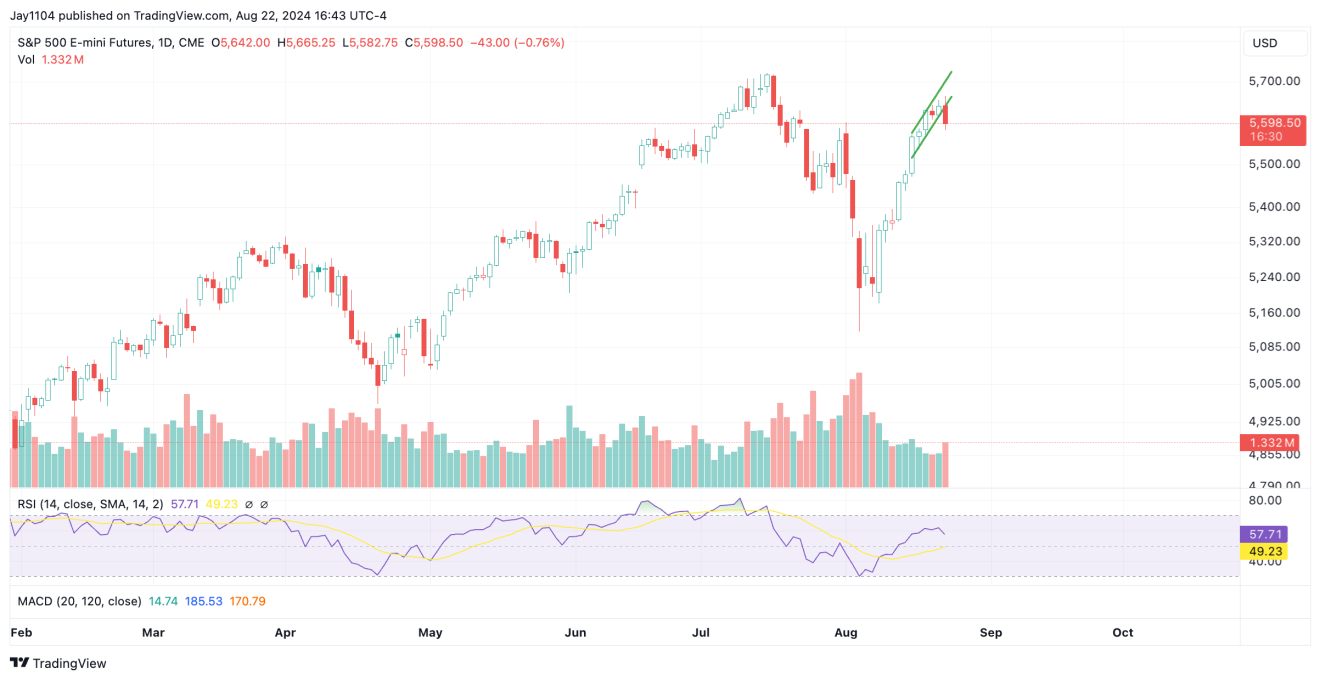
Volume was higher yesterday, and the S&P 500 futures broke an upward-sloping channel. The market rallies easily with low volume but stalls with higher volume, indicating more absence of sellers than buyers.
The break of the upward-sloping channel resembles a flag pattern, which often breaks lower.
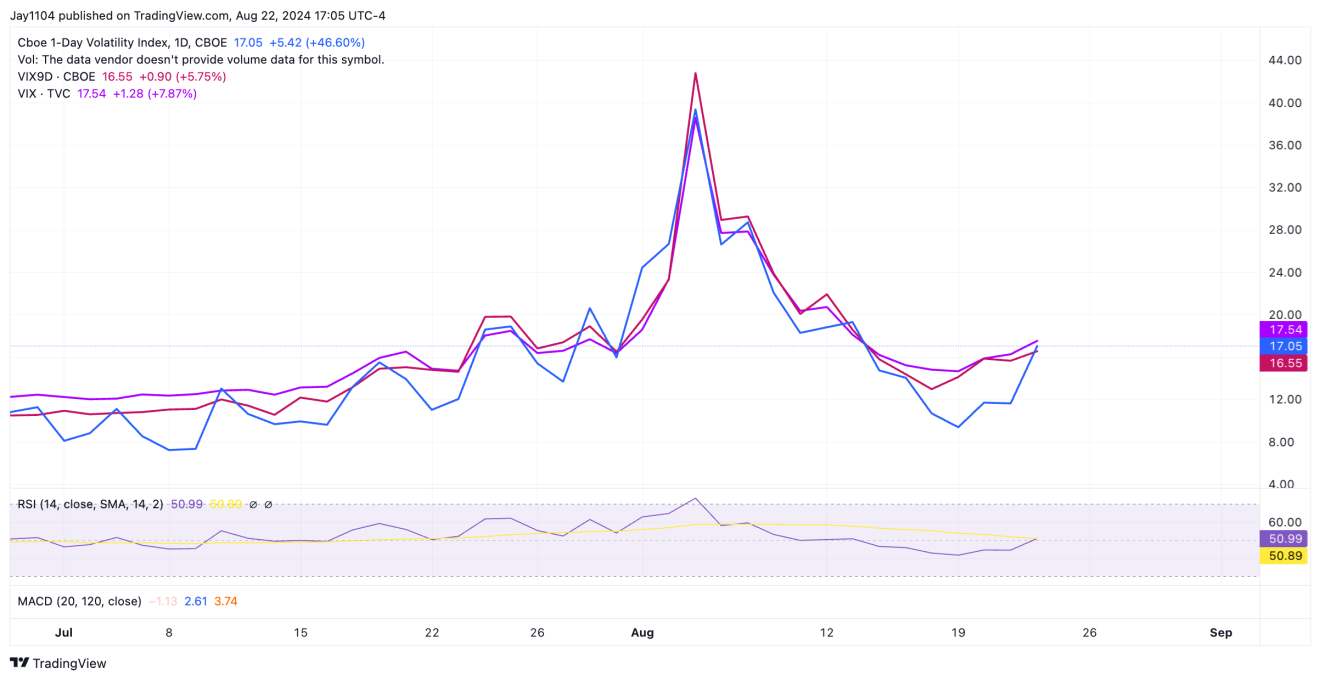
2. Volatility Crush Ahead?
The VIX jumped yesterday in anticipation of Powell’s speech at Jackson Hole. A volatility crush could occur during his speech, but unlike an FOMC meeting, trading continues for a full day afterward.
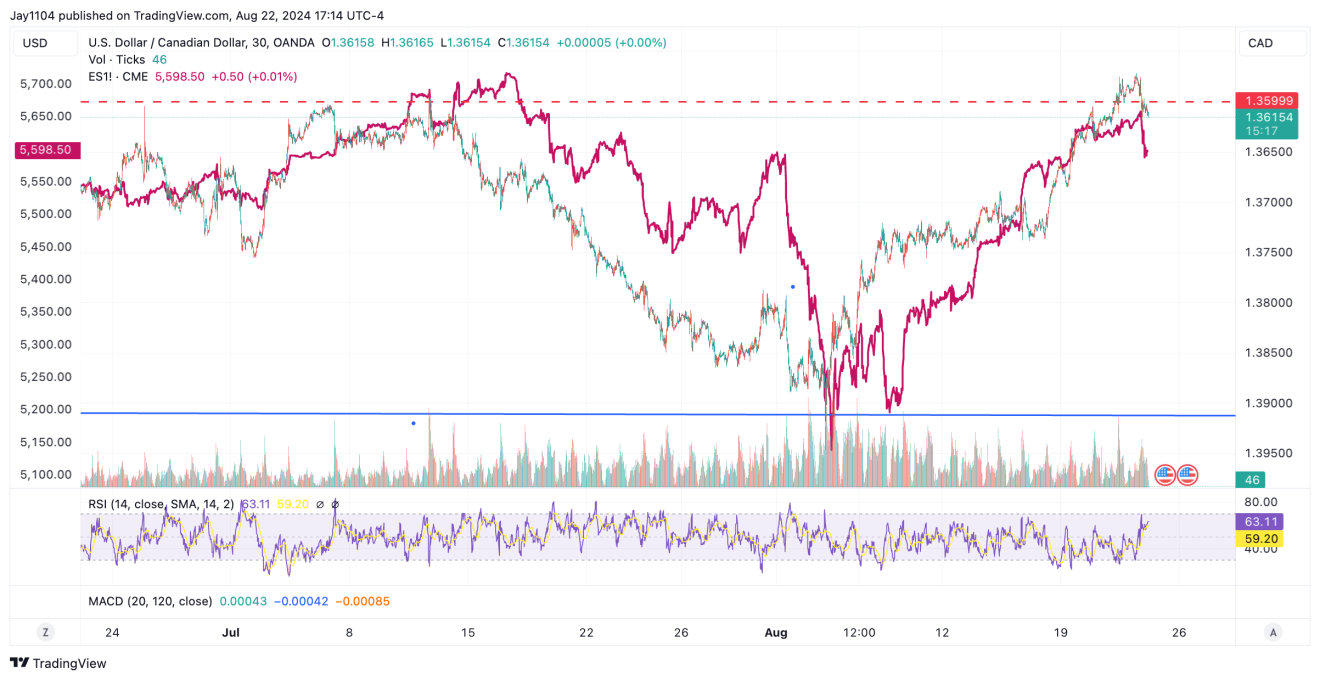
3. USD/CAD Correlation With S&P 500
Yesterday, the USD/CAD turned higher as the S&P 500 turned lower. The USD/CAD has support around the 1.36 level, aligned with a long-term uptrend and the 200-day moving average.
This 1.36 region is a strong candidate for a potential bounce towards the 1.39 area.
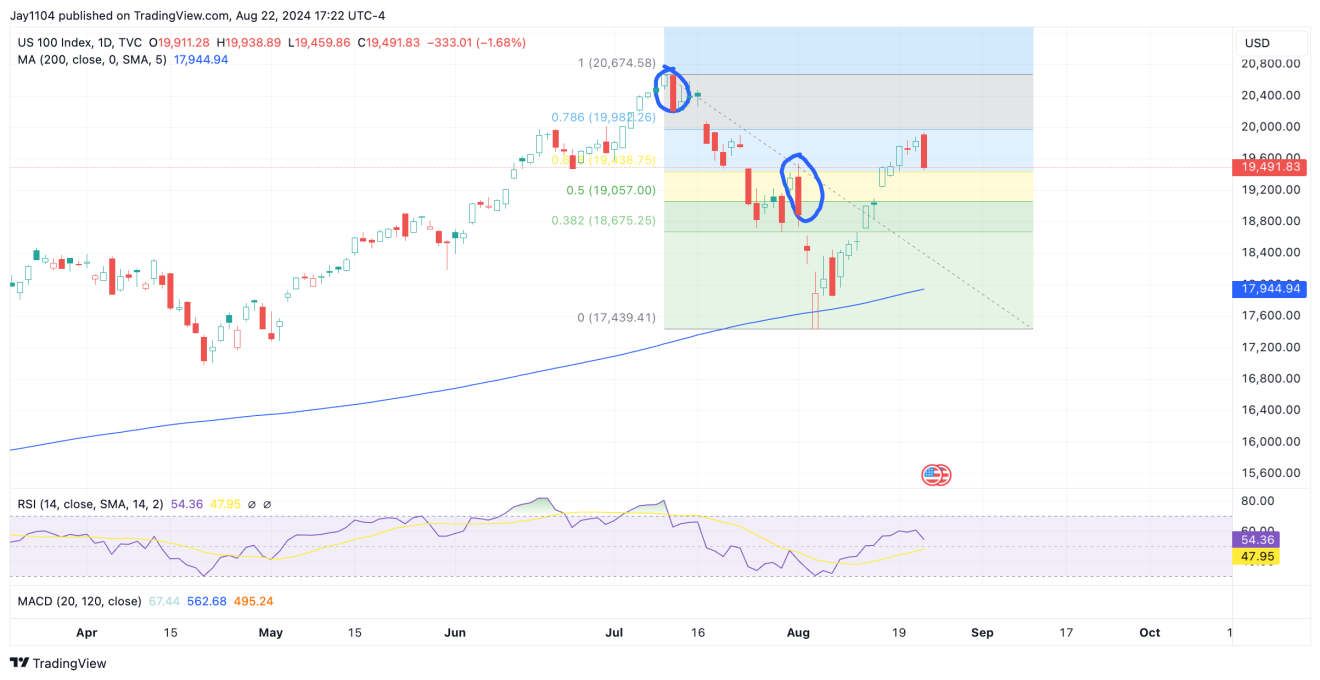
4. Bearish Engulfing Candle in Nasdaq 100, Semiconductors
The Nasdaq 100 approached the 78.6% retracement level yesterday before reversing and forming a bearish engulfing candle. Similar patterns in the past led to significant declines.
The SMH also hit its 61.8% retracement level and formed a bearish engulfing pattern, following the Nasdaq 100’s lead.
Nvidia also hit its 78.6% retracement level again, forming a bearish engulfing pattern.
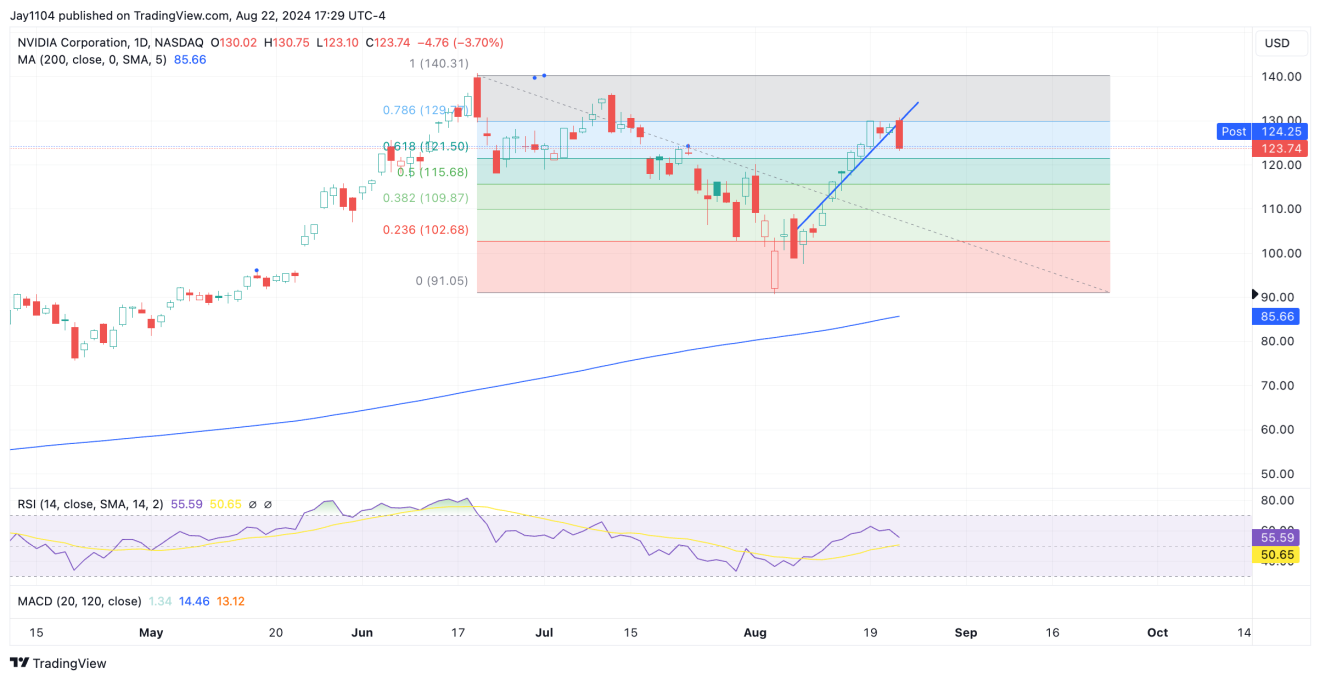
Today will reveal more, but evidence suggests a potential turning point for the market, possibly indicating a lower high.
5 Stocks Our Experts Predict Could Double In the Next Year
By submitting your email, you'll also get a free pivot & flow membership. A free daily market overview. You can unsubscribe at any time.