
To gain an edge, this is what you need to know today.
S&P 500 At 5000
Please click here for an enlarged version of the chart of SPDR S&P 500 ETF Trust SPY which represents the benchmark stock market index S&P 500 (SPX).
Note the following:
- The chart shows that S&P 500 is comfortably above the top band of the support zone.
- The chart shows that the move up is on lower volume. This is a negative.
- Historically, when S&P 500 hits the next 1000 benchmark, the median return is as follows:
- 0.57% after one week
- 2.00% after one month
- 3.5% after three months
- 7.73% after six months
- The above data is only history, and no one should depend on it. It is more important to understand how various groups behave.
- Sentiment moves higher in the extreme zone.
- Momo crowd buying becomes even more aggressive.
- Mom and pop who are normally not active in the stock market jump in.
- Bears throw in the towel and jump in.
- Underperforming money managers become aggressive buyers.
- Smart money takes advantage of the strength and trims positions.
- “Buy low and sell high” is a simple concept in theory. This is exactly what you need to do to consistently beat the stock market. However, in practice it is not as easy as it sounds for the following reasons:
- Human emotions of fear and greed.
- Market mechanics
- Market controlled by momo crowd
- Momo gurus
- Short squeezes
- Thousands of constantly changing variables from across the globe
- The key is to look at returns, not only in terms of absolute returns, but in terms of risk adjusted returns.
- As an actionable item, the sum total of the foregoing is in the protection band, which strikes the optimum balance between various crosscurrents. Please scroll down to see the protection band.
Jobless Claims
Initial Jobless Claims came at 218K vs. 218K consensus. This indicates that the jobs picture is staying strong. Initial Jobless Claims is a leading indicator and carries heavy weight in our adaptive ZYX Asset Allocation Model with inputs in ten categories. In plain English, adaptiveness means that the model changes itself with market conditions. Most models on Wall Street are static. They work for a while and then stop working when market conditions change.
Treasury Auction
Yesterday, we shared with you that the largest ever 10-year Treasury auction was still. Please read the Afternoon Capsule for details.
Today, there is a $25B 30-year auction. This is not the largest auction. The largest auction was $27B.
Investors are expected to trip over themselves to eagerly lend money to the U.S. government for 30 years at about 4%. This simple fact should be thought provoking among prudent investors about the current state of investor thinking. Would you lend to the U.S. government for 30 years at 4%?
Bard Becomes Gemini
Alphabet Inc Class C GOOG has changed the name of its large language model to Gemini from Bard. Google is also offering a paid version of Gemini. Google is trying to catch up with ChatGPT from Microsoft Corp MSFT and OpenAI.
For investors wanting to make a fortune in AI, it is important to build a strong background. For example, it is important to understand the challenges facing Google that have become opportunities for Microsoft.
China
Prices dropped at the fastest rate in China since 2009. Here are the details:
- CPI came at -0.8% year-over-year vs. -0.5% consensus.
- CPI came at 0.3% month-over-month vs. 0.4% consensus.
- PPI came at -2.5% year-over-year vs. -2.6% consensus.
In The Arora Report analysis, paradoxically these bad numbers are likely to instill urgency in President Xi to take measures to run up the stock market. We shared with you yesterday that China has a new regulator for securities.
In a surprise move, China has replaced its top stock market regulator. The new regulator is Wu Qing, a respected banker. In The Arora Report analysis, this surprise move is an attempt by President Xi to move the Chinese stock market higher.
Here was what happened the last two times a new regulator was appointed:
- The Chinese stock market went up 80% in two years, starting in 2019.
- The Chinese stock market went up 40% in two years after 2016.
Japan
Nikkei 225 in Japan went up 2.1% on talk of the Bank of Japan exiting the negative rate policy. Nikkei 225 closed at 36,863. It has taken over 34 years for Nikkei 225 to come close to its prior high of 38,957 on December 29, 1989. In The Arora Report analysis, prudent investors should look at the 34 year period before assuming bear markets do not last very long.
Magnificent Seven Money Flows
In the early trade, money flows are positive in Tesla Inc TSLA.
In the early trade, money flows are neutral in GOOG, Apple Inc AAPL, and MSFT.
In the early trade, money flows are negative in Meta Platforms Inc META, NVIDIA Corp NVDA, and Amazon.com, Inc.
Diving into Early Trade Money Flows
Momo Crowd And Smart Money In Stocks
In the early trade, the momo crowd exhibits an appetite for stocks, while smart money remains inactive.
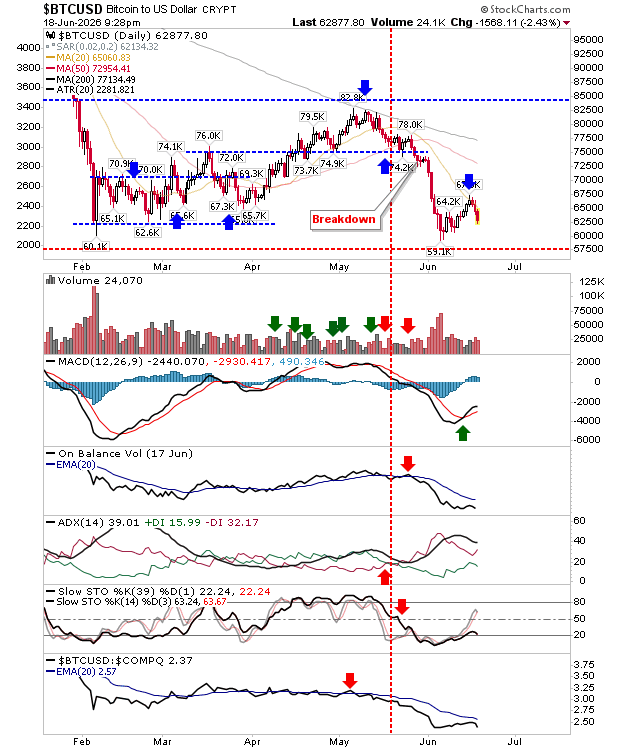
Gold and Bitcoin
Money is shifting from the safety of gold to the allure of bitcoin and stocks, with the momo crowd showing a tendency to sell gold.
Amidst this, bitcoin is experiencing vigorous purchasing by “whale memes” in anticipation of a potential surge in the cryptocurrency’s value.
Oil and Protection Bands
The momo crowd is displaying a preference for oil in the early trade, while smart money remains inactive.
As for investors, it is vital to look ahead rather than rely solely on past performance.
Considering the future, investors should contemplate maintaining long-standing positions and strategically incorporating a protection band to safeguard their portfolios while capitalizing on potential upticks.
Traditional 60/40 Portfolio
The current risk-reward scenario, adjusted for inflation, does not favor a long-term strategic bond allocation.
Those adhering to the traditional 60% stock and 40% bond allocation should consider focusing exclusively on high-quality and shorter-duration bonds. A more sophisticated approach may involve employing bond ETFs as tactical positions rather than strategic ones at present.
It is essential to emphasize the importance of holding sufficient cash to take advantage of upcoming investment opportunities.
5 Stocks Our Experts Predict Could Double In the Next Year
By submitting your email, you'll also get a free pivot & flow membership. A free daily market overview. You can unsubscribe at any time.