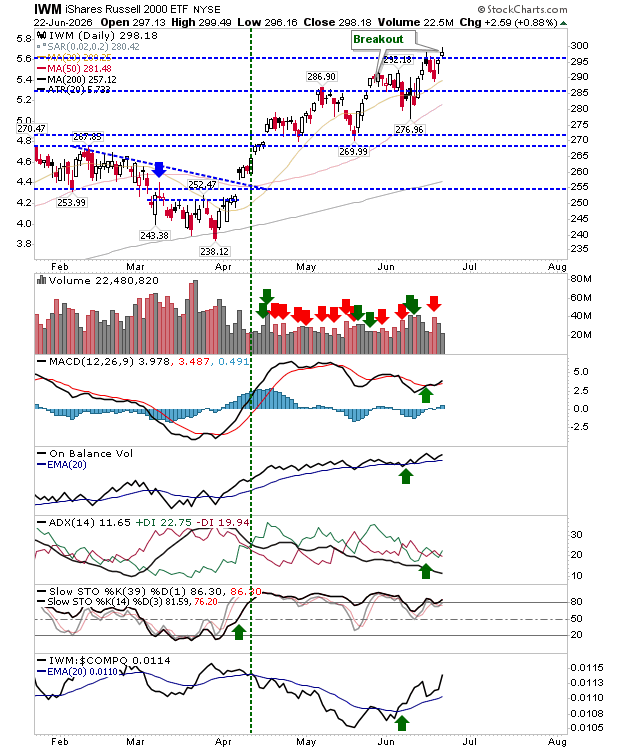
A quiet start to the week with only the () suggesting it could be on the move (higher). Monday’s action registered as a breakout, albeit on low volume, but with technicals net positive. The Russell 2000 has been outperforming the since the start of June, so it has the interest of market participants and is the best placed for those seeking new long trades.
Some things to watch in other indices. The continues to play out the reversal from the Tweezer Top. It’s currently down at its 20-day MA with the 50-day MA and 8,320 support next on the test-list. It should see demand at the latter level should it get there.

is in an interesting state. It had sold off hard into the February low and this should have been the catalyst for a sustained rally. Instead, we got a low key rally to the 200-day MA before sellers returned. We now see it struggling at its 20-day MA having made an initial bounce on the February low retest. Monday’s inverse hammer looks like another shorting opportunity with a stop above Monday’s high.
are showing another topping doji, similar to that from the end of may. Technicals are net positive. So far, these peaks haven’t resulted in an extended decline, but Monday’s finish is a marker for one.
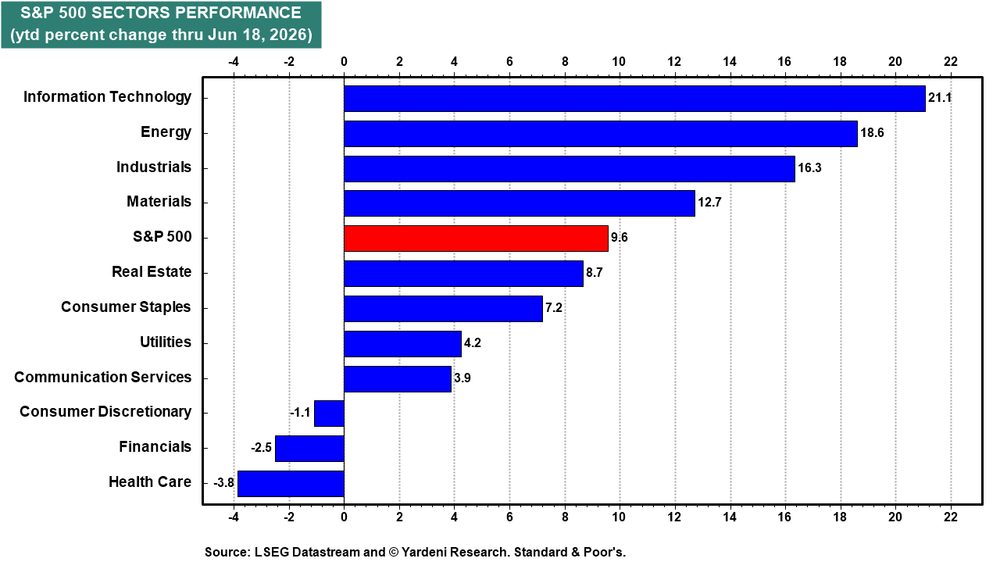
For today, we will want to see which side of the market will win out: bulls for the Russell 2000, bears for the equal-weighted S&P. Expect the winner to influence other markets and break the bull/bear picture of the Russell 2000 or equal-weighted S&P.
5 Stocks Our Experts Predict Could Double In the Next Year
By submitting your email, you'll also get a free pivot & flow membership. A free daily market overview. You can unsubscribe at any time.