The public market is currently obsessed with the “brains” of artificial intelligence. Every quarter, retail investors and momentum traders wait with bated breath for Nvidia’s latest earnings print, counting how many specialised graphics processing units (GPUs) tech titans are buying. But underneath the hype, a cold, structural reality is beginning to settle over Silicon Valley.
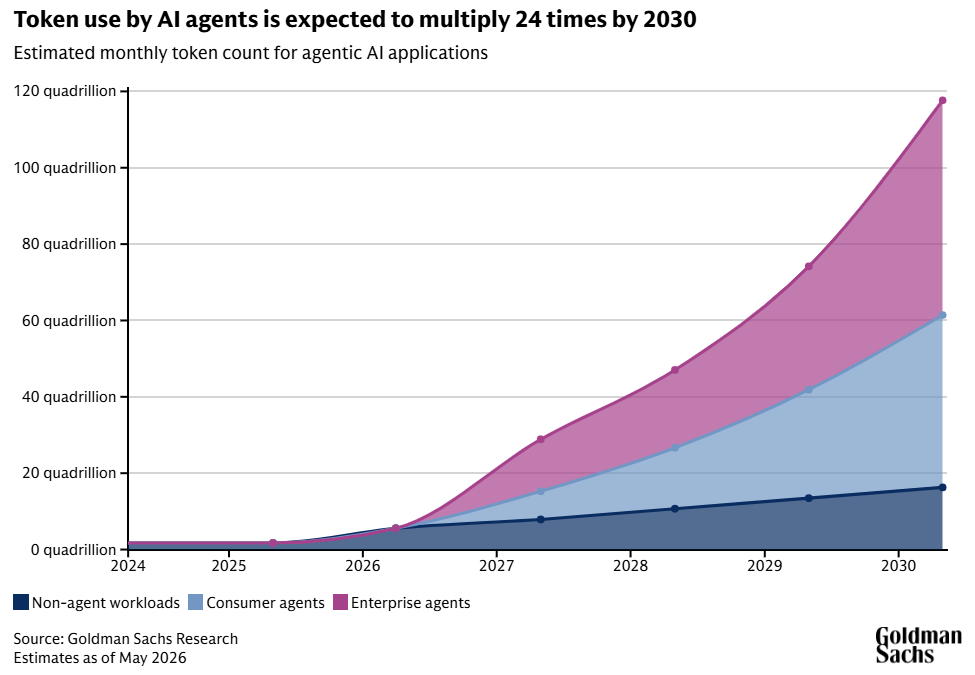
As I mentioned in yesterday’s post on $RIOT, the next bottleneck for artificial intelligence is not silicon, algorithms, or software. It is raw electricity. Jenson Huang has dropped strong hints regarding this macro shift. Management recently noted that governments worldwide should treat AI development not as a mere software trend but as foundational as electricity grids and roads.
They followed this up with an even starker warning: energy is the next global bottleneck for artificial intelligence. As hyperscale data centres expand at a breakneck pace, the physical limitations of electrical grids, utility capacity, and power generation are catching up with the technology sector. Meanwhile, the smart money—or ‘rascals’ as David and I like to call them, operating behind the scenes in institutional dark pools—has already processed this reality. They are executing a mass sector rotation from overextended technology stocks to the unheralded gatekeepers of the power grid. To identify the true infrastructure providers of the AI era, we need to look at the multi-year accumulation charts of top-tier Bitcoin mining operations such as ($CLSK) and ($RIOT).
The Sovereign Bottleneck: Silicon vs. Steel
For the past several years, the growth of artificial intelligence has been restricted solely by semiconductor manufacturing capacities. The primary financial equation was simple: if a company could secure supply chain allocation of high-performance chips, its corporate earnings soared. However, a massive cluster of AI servers requires massive, stable, base-load power. Running thousands of next-generation chips inside mega-data centres demands gigawatts of energy. In industrialised nations, securing approval for a new utility-grade grid interconnection is not only an administrative nightmare that frequently takes between three and seven years. This creates a massive barrier to entry. An AI company can buy a billion dollars’ worth of processors tomorrow, but if they lack a high-voltage plug to insert them into, those processors are nothing more than incredibly expensive paperweights.
This infrastructure constraint is exactly why corporate leaders are adjusting market expectations. By introducing the narrative of an unavoidable “energy infrastructure bottleneck,” sophisticated tech companies can insulate their premium valuations. If revenue growth begins to flatten or encounter a structural stall in the coming quarters, company executives have an elegant, external explanation ready: “Our order backlogs are larger than ever, but our hyperscale clients must wait for regional energy grids to deliver the power required to switch our systems on.”
Market Forensics: How the ‘Rascals’ Accumulate Power Assets
While retail traders chase green breakout candles at the tail end of massive trends, institutional accumulation happens silently, slowly, and entirely hidden from the public eye. Understanding this dynamic requires a mastery of Volume Price Analysis (VPA)—the study of the relationship between price spread, chart structure, and transacted volume.
Institutional funds cannot simply log on to a retail brokerage and buy 50 million shares of an infrastructure stock without instantly driving the asset price through the roof. If they create a massive visible spike, they destroy their own average cost basis. To counter this, they deploy a specific playbook: Stealth Absorption.
Their strategy is to rely heavily on dark pools—private, alternative trading systems that allow institutional participants to cross-trade massive blocks of shares without printing the transactions on the public order book in real time. This allows them to systematically absorb a stock’s floating supply over months, or even years, while intentionally keeping the public price pinned within a rigid, horizontal trading range. The footprint of this behaviour cannot be hidden from a chart technician. On a true long-term chart (the weekly or monthly timeframes), this off-exchange buying appears as a massive, anomalous surge in trading volume that fails to move the price dial.
CleanSpark ($CLSK): A Textbook Case of Institutional Absorption
CleanSpark ($CLSK) represents a prime example of this phenomenon. Historically categorised by casual market participants as a pure-play cryptocurrency mining firm, CleanSpark has spent years aggressively acquiring high-density data centres and securing an immense portfolio of fully contracted, utility-approved power assets across strategic regions such as Texas and Georgia.
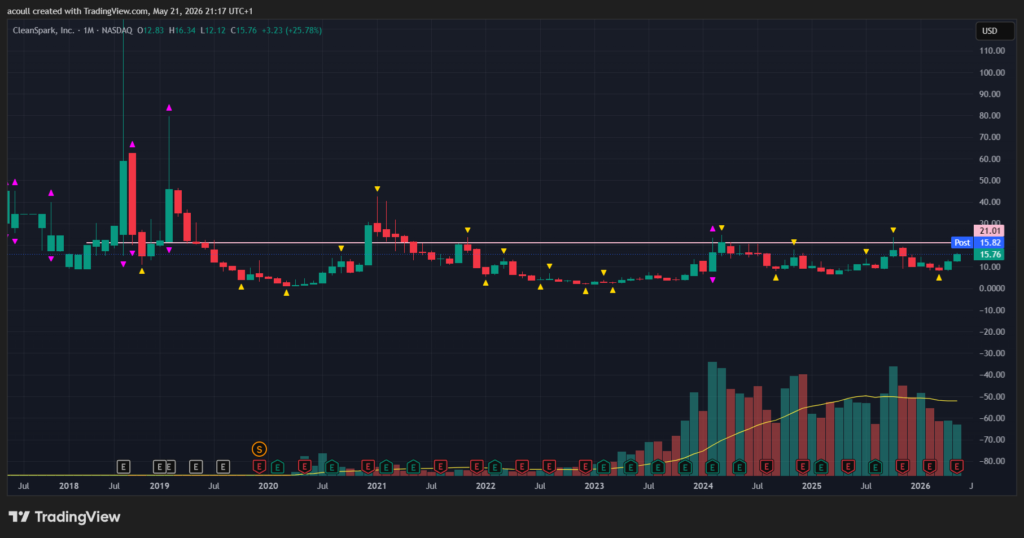
And if we look at CleanSpark’s monthly chart, the structural evidence of institutional absorption is undeniable. Throughout 2024 and 2025, the monthly volume indicators printed towering blocks of activity. Yet, despite this historic influx of trading energy, Cleanspark’s price remained rigidly range-bound, flatlining between a well-defined floor at $10.00 and a persistent resistance ceiling near $20.00–$21.01.
In standard technical analysis, this long-term sideways movement is often mistaken for a lack of momentum, but from a VPA perspective, it is a perfect expression of Wyckoff’s second law of cause and effect. We could also say it represents a massive Slingshot Foundation. If this colossal volume profile had been driven by genuine institutional distribution (selling), the price would have collapsed through the floor into a technical spiral. If it had been driven by an uncoordinated retail chase, the price would have exploded vertically. The tight, capped price action, combined with record-shattering volume, is the unmistakable fingerprint of the rascals quietly clearing the market of sellers and loading up on millions of shares via the dark pools while maintaining a flat public profile.
The Derivatives Fuel: Options and the Short Squeeze
As CleanSpark trades at $15.76, its underlying market plumbing is coiled extraordinarily tight. A look into its derivatives data shows an exceptional structural alignment:
1. The $15.00 Put and Call Wall:
Both major options walls currently sit directly at the $15.00 handle, converting this price point into an incredibly powerful behavioural anchor and institutional support matrix.
2. The Positive Gamma Buffer:
With the current price trading comfortably above the $12.62 Gamma Flip line, the stock is operating entirely within a positive gamma environment. This forces option market makers to systematically buy CLSK shares during minor intraday pullbacks to maintain neutral hedges in their accounts.
However, there is another aspect we need to consider: the current short interest. According to Finviz, almost 40% of Clearnspark’s public float is currently sold short (although other platforms report a higher percentage, at 49%), and as of the latest settlement date, this equates to approximately 90 million shares sold short.
This creates a highly asymmetric setup. The rascals have locked up a vast number of available shares through historical dark-pool accumulation, leaving the floating supply highly illiquid. If CleanSpark’s price experiences a high-volume monthly breakout above the critical $21.01 pink resistance line, shown in the chart above, the short sellers will find themselves completely trapped. They will be forced to buy back 90 million shares into a market where no one is selling, triggering an explosive gamma and short squeeze into a blue-sky markup phase.
Slower Timeframes: Why Traders Must Respect the Tide
The multi-year accumulation framework visible in CleanSpark underscores a vital trading law that market participants ignore to their own detriment: market and chart structure must always dictate trading tactics. Short-term market participants frequently obsess over brief, intraday intervals—the 1-minute, 5-minute, or 15-minute charts. While these fast timeframes are excellent for executing precise entry points and managing tight stop losses, they are completely blind to the macro cycles that govern institutional capital. Intraday charts represent what David and I often refer to as the “waves” of the market, but the weekly and monthly timeframes represent the structural “tide.”
An institutional fund manager does not open a position based on a technical indicator cross on a 5-minute chart. They evaluate macro supply deficits, energy capacities, sovereign bottlenecks, and regulatory landscapes. They build their positions over months, leaving clear footprints on the monthly chart.
If a trader attempts to day-trade or swing-trade a stock without analysing its slower timeframes, they are effectively flying completely blind. They risk shorting an asset sitting atop a massive monthly volume floor, or aggressively buying a tech stock executing a monthly buying climax directly into an unyielding options call wall. When the slower timeframes conflict with short-term signals, the macro tide wins every single time.
Conclusion: Preparing for the Infrastructure Markup Phase
The global financial landscape is on the verge of a significant structural shift. As the market encounters the harsh realities of the physical grid, the capital that drove the initial software and semiconductor rally will inevitably seek out the energy infrastructure powering the next phase of the digital age. By utilising Volume Price Analysis, monitoring institutional dark-pool flow, option market dynamics and short interest, traders can move away from speculative retail sentiment and align their capital directly with ‘the rascals.’
Asset plays like CleanSpark and RIOT, which we considered yesterday, have spent months and years building a structural foundation through quiet, high-volume accumulation, and are primary candidates to lead this rotation.
Do not let short-term market noise blind you to long-term charts. Track the volume anomalies, respect the monthly support and resistance boundaries, and let the broader market structure guide your tactics. The power grid is being quietly acquired under the surface, so make sure you are positioned alongside the smart money.
Please do your own due diligence!
5 Stocks Our Experts Predict Could Double In the Next Year
By submitting your email, you'll also get a free pivot & flow membership. A free daily market overview. You can unsubscribe at any time.