Things started getting a bit ridiculous toward the end of last week. Say what you want, but the concentration in daily activity in the is increasingly centered around semiconductors. In fact, based on my internal estimates, Micron (NASDAQ:) was the single largest contributor to the index move on Friday, followed by , , , , , , , , and .
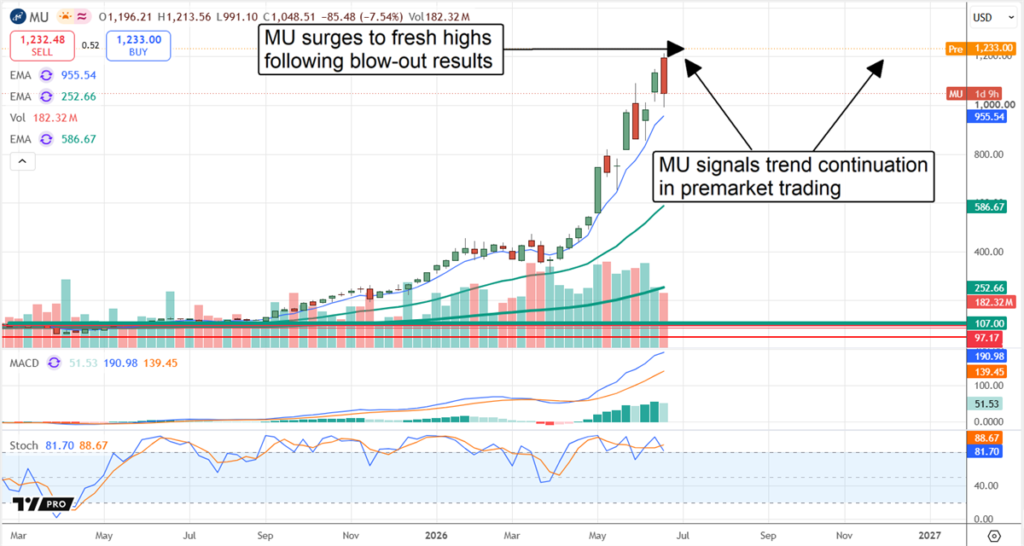
When you dig a bit deeper, the options volumes going through stocks like Micron seem, frankly, pretty insane. Micron appears to be in the middle of a massive gamma squeeze, with implied volatility steadily rising, call volumes off the charts, and the stock price surging. The good news, at least potentially, is that this week is options expiration, which may give the market a chance to flush out some of the excess.
Technically, the stock looks beyond stretched, trading above its upper Bollinger Band, with an RSI of 84, and — get this — trading 157% above its 200-day moving average. Even in March 2000, Micron traded “only” 78% above its 200-day moving average.
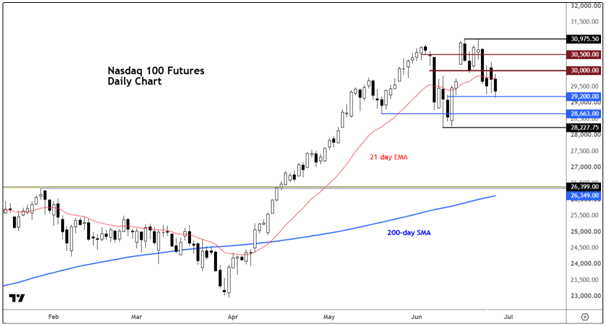
The is also trading above its upper Bollinger Band, has an RSI above 70, and is trading nearly 60% above its 200-day moving average. The only other times the index traded this far above its 200-day moving average were in July 1995 and March 2000. Neither ended particularly well.
At this point, it seems clear to me, from both a technical and an options-market perspective, that there is a good chance these moves have not only become overextended but have entered the land of the absurd. Like Oracle (NYSE:) rising 35% in a single day absurd. It is not as if the stock is even cheap, trading at nearly 5.5 times next-twelve-month sales estimates.
This week, the Treasury will shift from paying down T-bills and injecting cash into the funding markets to becoming a net issuer of T-bills again, restarting the draining process. That begins with roughly $13 billion in bill settlements and another $42 billion in coupon settlements. T-bill issuance should ramp up significantly in the days to come.
The paydown phase has treated the market fairly well. Coupon settlement days have generally been less favorable, though not disastrous. Net T-bill issuance days, however, have not been kind to the market since the reverse repo facility was effectively drained. Whether that relationship continues during this semiconductor mania remains to be seen.
Since the end of October, paydown days have seen the S&P 500 rise 64% of the time, compared with 52.4% for non-paydown days. Paydown days have also averaged gains of 59 basis points, versus 66 basis points on non-paydown days. However, on down days, paydown days have averaged losses of 47 basis points, versus losses of 66 basis points on non-paydown days.
Treasury bill settlement days, meanwhile, have seen the market rise only 24% of the time, compared with 62% for non-settlement days. Settlement days have averaged gains of just 50 basis points, versus 66 basis points on non-settlement days. More importantly, on down days, the S&P 500 has averaged a 94-basis-point decline on settlement days, compared with a 52-basis-point decline on non-settlement days.
5 Stocks Our Experts Predict Could Double In the Next Year
By submitting your email, you'll also get a free pivot & flow membership. A free daily market overview. You can unsubscribe at any time.