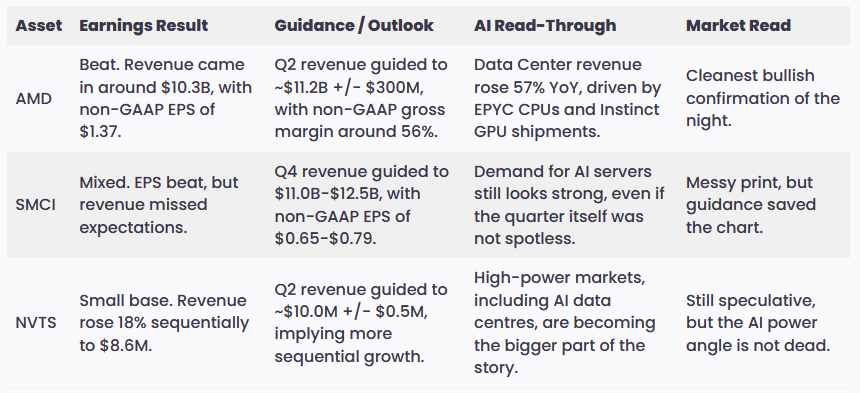
Last night’s AI earnings basically gave the rally what it wanted: actual revenue, better guidance, and another reason to keep the AI trade alive. But this was not all the same quality of earnings. was the cleanest print. Super Micro Computer (NASDAQ:) was messy but saved by guidance. Navitas Semiconductor (NASDAQ:) was still the speculative power-chip story, but not a complete disaster.
For traders, the bigger question now is whether Nasdaq uses this as another launch pad, or whether the market pulls the classic gap-up-and-fade move. The AI story survived last night. Now price has to prove whether that story was already priced in.
Earnings and Guidance Snapshot

AMD: The Train Blew Past Expectations
AMD’s blowout earnings led to a more than 20% overnight rally after initially dropping into the anchored VWAP drawn from around $310. This completely blew past the $389.38 options implied move, and honestly, it surprised me.
While I did have an inkling that AMD could reach $400, this thing flew. There’s no real telling where this choo-choo train stops now, but it is clear that AI spending is driving AMD’s revenues, in line with the current market trend.
A potential take-profit target could be around $420 (funny number), where the cup-and-handle measured move sits. This pattern formed during the breakout after market hours and has a neckline around $363. But again, this is only a subjective target as AMD trades into blue sky territory. The 1.618 Fib extension target sits near $426.34, which adds another layer of confluence.
General Outlook/New Developments:
AMD now has the cleanest “AI is spreading beyond Nvidia” story from this batch. Data Centre is no longer just a supporting segment; it is now the main growth engine, helped by EPYC server CPUs, Instinct GPU shipments and stronger customer engagement around future MI450 and Helios deployments.
The bullish case is not that AMD suddenly becomes Nvidia overnight. It is that the market now has a real second AI winner to price, and that is why the move had so much force behind it.
SMCI: Messy Print, But the Guide Kept Bulls Awake
SMCI is also painting a similar technical picture. After a quick decline due to a liquidity grab at around $26, the yellow-marked zone, SMCI, shot up after hours to around $33.99, narrowly missing $34. Either way, that high lines up with many of its March highs, so as a take-profit target or rally slow-down zone, it makes total sense.
For this rally to be sustained, we need to see the $30.50 price level HOLD before the Friday options expiry. If this happens, a pool of buy liquidity could enter the market, potentially giving SMCI the fuel to continue higher.
There are two key supports to watch: the $31.74 point of control, which is the highest volume-traded level since the decline in November 2025, and the $30.50 options wall itself.
If price slumps below that wall, we want to see a reclaim, or a failed reclaim through a successful bearish retest, to switch short-term bias to the downside. From there, price may retrace back into the long wick at $25.71 to $27.88, where we can assume large amounts of buy orders entered the market.

General Outlook/New Developments:
SMCI was not a clean earnings winner. Revenue missed, cash flow was ugly, and the company still carries baggage. But the market chose to focus on guidance, margin recovery and AI server demand instead. That makes this a momentum trade first and a fundamentals victory lap second.
If $30.50 holds, bulls still have a reason to press. If it fails, the “guidance saved us” narrative starts looking much thinner.
NVTS: Still the Lame Duck, But the AI Power Story Is Not Dead
Navitas was more of a lame duck compared with AMD and SMCI. Price simply worked both sides of its range, but eventually chose to slump back down toward the range low around $16.
Technically, we are still range-bound on this asset, and both options implied move zones, around $20 and $14, remain valid levels to watch. Until the price actually breaks above the range, this is still a trader’s range more than a breakout trend.
General Outlook/New Developments:
Navitas is not an AMD-style revenue machine. It is still a small, speculative AI infrastructure play. The new development is that its high-power markets, including AI data centres, grid infrastructure, performance computing and industrial electrification, are becoming a larger part of revenue.
That keeps the story alive, but the chart is still telling us not to get too excited until the range breaks with actual follow-through.
Nasdaq-100 Outlook Based on AI Earnings Aftermath
Now onto the more actionable insight for traders without access to AMD, SMCI and NVTS stocks: the Nasdaq-100 itself.
Nasdaq-100 closed at 28,015, and with positive AI earnings after hours, the idea of a gap up is plausible. But I would be careful with the wording here: the earnings create a strong reason for futures and premarket sentiment to lean higher, but the cash session still has to confirm whether buyers actually want to chase the move.
There are two exhaustion signals on Nasdaq that should not be ignored:
- A trendline marked by two highs, aligning nicely with the rising channel’s midline at around 28,200.
- A bearish divergence on the hourly timeframe across most oscillators, with the displayed example being Stochastic RSI.
If Nasdaq gaps up, we need to see the following to prove that markets still want to climb higher and are not just using the AI earnings pop as exit liquidity:
- The midline zone around 28,200 needs to hold, ideally with acceptance rather than just a wick.
- The rising channel itself needs to hold. For now, the lows are approximately around 27,700.
It is worth noting that Nasdaq has so far been finding support at previous highs during this rally. The first support zone would kick in around 27,592 to 27,822, which also lines up with the rising channel’s lower area.
Should a break of the rising channel occur, it would be a sign that strong AI earnings may have already been priced in, especially if AMD, SMCI and the wider chip complex also start pulling back. Prior highs sit around 27.3K, 27K and 26.4K, all potential support zones if the first layer breaks.

General Outlook/New Developments:
The Nasdaq setup is not bearish by default. It is stretched. That is the difference. Strong AMD and SMCI reactions give the index a reason to gap higher, but if that gap cannot hold, the market may be telling us that the AI trade is becoming too crowded in the short term.
The cleaner read is simple: a hold above the channel midline keeps the rally alive; a failed gap and channel break turns the strong earnings reaction into a possible exhaustion signal.
Bottom Line
Last night’s AI earnings were bullish, but not equally bullish across the board. AMD delivered the cleanest confirmation. SMCI gave traders enough forward guidance to forgive a messy revenue miss. Navitas kept the AI power-chip story alive, but it still needs price confirmation.
For Nasdaq, the gap-up assumption is accurate as a plausible setup, not as a conclusion. The market has a reason to open higher. Now it has to prove it can stay higher.
Disclaimer: For educational purposes only. Trading comes with substantial risk, leading to possible loss of your capital. Traders are advised to do their own due diligence before investing.
5 Stocks Our Experts Predict Could Double In the Next Year
By submitting your email, you'll also get a free pivot & flow membership. A free daily market overview. You can unsubscribe at any time.