The first half of 2026 is one that Microsoft Corporation shareholders would just as soon forget. The stock is down approximately 20% as of July 1. As recently as June 24, hit a 52-week low of $349.20.
It hasn’t all been downhill. But every time it looked like MSFT was getting ready to recover, something happened to knock it back. Nevertheless, both fundamental and technical signs, starting with a forward price-to-earnings (P/E) ratio of 22.9x, suggest that Microsoft is due for a reversal. That could make MSFT the best big tech trade for the second half of 2026.
When a Strength Became a Weakness
The size and scope of Microsoft’s business have worked against it as investors have found multiple reasons for concern. In late 2025, investors were concerned that a hyperscaler like Microsoft would pause or reverse course on its data center capital expenditures.
Instead, the company doubled down on its spending and now plans to spend $190 billion in this calendar year. Of course, that turned into a concern that Microsoft and other hyperscalers are now spending too much money, which will either hit their free cash flow or show up on the balance sheet as debt—neither of which is positive for earnings growth.
Then, the “SaaSpocalypse” hit. The concern was that the emergence of open-source models like Anthropic and OpenAI would reduce demand for Microsoft’s Copilot. However, in its most recent earnings report, the company noted that Copilot had over 20 million paid seats.
One of the latest issues facing the company is the cost of memory. That acutely impacts Microsoft’s gaming division and popular Xbox. It also reminds investors of how interconnected all of these technology companies are, particularly as it relates to the artificial intelligence (AI) infrastructure trade.
That’s a lot of noise for investors to drown out. But for those that can, there’s a strong case for growth in the second half of 2026.
The Numbers Behind the Noise
Let’s start with the fundamentals. Microsoft’s Q3 2026 earnings report undercut the bear case. Revenue grew 18% year-over-year to $82.9 billion, and diluted earnings per share (EPS) rose 23% to $4.27, beating estimates on both lines. The bull case went beyond the headline numbers:
Microsoft Cloud revenue climbed 29% to $54.5 billion, with Azure growing 40% year-over-year, an acceleration from the prior quarter.
Total AI annualized revenue run rate surpassed $37 billion, up 123% from a year ago.
Operating income rose 20% to $38.4 billion.
The company returned $10.2 billion to shareholders through dividends and buybacks.
None of that sounds like a company in trouble, yet the stock kept sliding after the report. However, that disconnect between accelerating fundamentals and a falling share price is exactly what value-oriented traders look for. It suggests the market is pricing in a worst-case scenario that isn’t backed up by the numbers.
MSFT Shows Signs of a Tepid Recovery
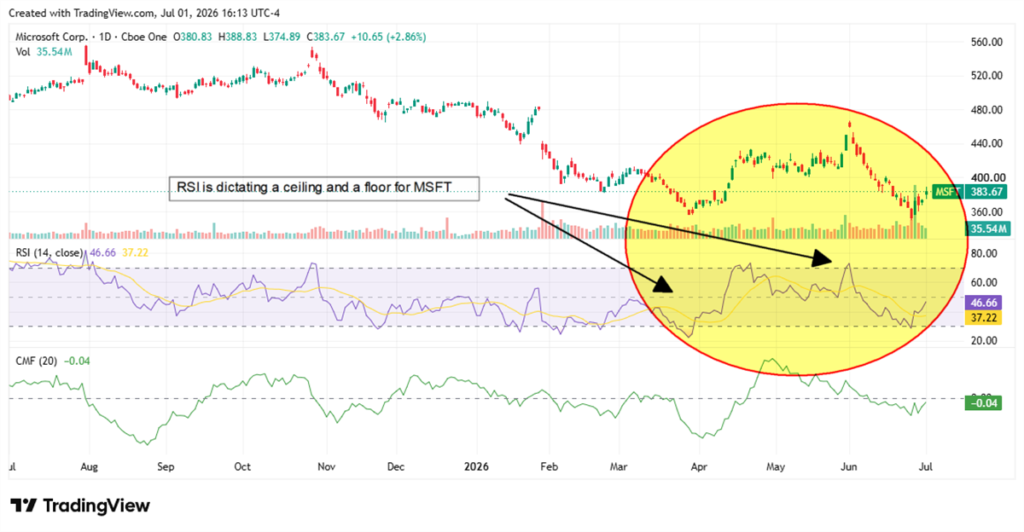
The chart backs up the reversal thesis. MSFT fell from a 52-week high near $555 in October to the June 24 low of $349.20, a decline of roughly 37%.
The RSI sits at roughly 47, climbing back from oversold territory below 30 in April. That April dip marked the stock’s sharpest capitulation, followed by a rally above $460 in May before renewed selling pressure returned.
Some of that selling pressure is due to a slowdown in institutional buying. To be clear, institutional buying outweighs selling by over 3:1. But it slowed down in the first two quarters of the year, which has given sellers the upper hand.
That shows up in the Chaikin Money Flow (CMF) indicator. This quantifies money flowing into or out of a security over a set period, typically 20 or 21 trading days. The reading of -0.04 is essentially neutral after spending most of April through June in a downtrend. A shift into positive CMF readings would confirm institutional money is rotating back into the stock.
Shares jumped 3% on July 1, closing at $384.28 on volume of 47.23 million shares, a sign of renewed interest after weeks of drifting lower. A close above the $400 level, which has capped rallies since March, would be the clearest signal yet that the reversal is underway.
The Bear Case Still Deserves a Hearing
No trade is without risk. Capital expenditures, including finance leases, hit $31.9 billion in the quarter, up 49% year-over-year, and free cash flow fell 22% to $15.8 billion as a result. If AI demand growth slows, that spending will make MSFT more of a margin story than it already may be.

Plus, the rising memory prices may not be critical, but they are squeezing the More Personal Computing segment, where Xbox hardware revenue fell 33%. If costs remain elevated into the holidays, that pressure could spread further, despite the company’s recent layoff announcement aimed at addressing some of that inefficiency.
Why the Setup Favors Patient Buyers
Investors need to weigh the risks against the valuation. Through that lens, Microsoft still looks attractive. A forward P/E near 23x sits below the stock’s five-year average and well under high-flying peers like NVIDIA and Palantir, despite Microsoft posting some of the most durable growth in the group.
For investors willing to look past near-term volatility, the combination of accelerating AI revenue, a 20-million-seat Copilot business, and a technical setup stabilizing after a brutal correction makes MSFT worth watching closely as the second half of 2026 gets underway.
5 Stocks Our Experts Predict Could Double In the Next Year
By submitting your email, you'll also get a free pivot & flow membership. A free daily market overview. You can unsubscribe at any time.