Listen to the audio version of this article (generated by AI).
Editor’s Note: One of the biggest lessons I’ve learned after three decades in the options market is also one of the simplest…
Stop trading the story and start trading the structure.
Once you do that, you start seeing what’s really moving markets — the divergences between related assets, the mispricings, and the shifts in capital that often matter far more than whatever headlines are dominating the news.
In today’s essay, I’m showing you how we use one of my favorite tools we use to discover those opportunities hiding in plain sight — the expected move. It’s software I built from the ground up to show you how to stop guessing where a stock might go and start identifying where the market is actually pricing the move.
That’s the kind of approach that smart traders need more than ever right now. And no one understands this point better than my friend and colleague Louis Navellier.
Over the last week, we’ve been looking at the same market dynamic across AI stocks, bonds, commodities, and more. We’re seeing where the smart money is positioning – and we’re using our expertise to help you stay one step ahead of the next headline news bomb.
This Tuesday, September 8th, I’m bringing Louis on Masters in Trading LIVE at 11 AM EST to dig even deeper into how expected move fits into our process, what the latest readings are telling us, and the trade setups we’re both watching right now.
Most traders — especially newer ones — react to stories. They trade off instincts.
They’re afraid of missing out on the next big thing. So they frame every move in terms of “why” instead of “what.”
But professionals don’t trade that way.
At Masters in Trading, we don’t put capital at risk without a reason grounded in objective data.
Because while headlines create noise, markets run on something far more concrete — hedging pressure, volatility expectations, liquidity flows, and institutional positioning.
If you’re not anchored to that data, you’re not trading the market — you’re reacting to someone else’s interpretation of it.
After more than two decades trading professionally — managing risk across global futures, equities, and options; executing institutional order flow; and teaching traders around the world — I’ve learned one very important lesson…
Objective data is the great equalizer.
It shifts you out of prediction and into probability. And once you understand what the market expects — how often price stays inside those expectations, and how market makers hedge around those zones — everything changes.
You stop guessing and chasing names. And that’s when you start positioning with confidence.
That’s the foundation of everything we do at Masters in Trading. It’s why we track unusual options activity relentlessly.
And it’s why we always rely on one indicator that tells us exactly how to trade volatility in the stock market – the Expected Move.
The Expected Move Matters More Than Headlines
The Expected Move is one of the simplest — and most misunderstood — tools in the market.
On the surface, it just looks like two lines on a chart. But those lines carry a tremendous amount of information.
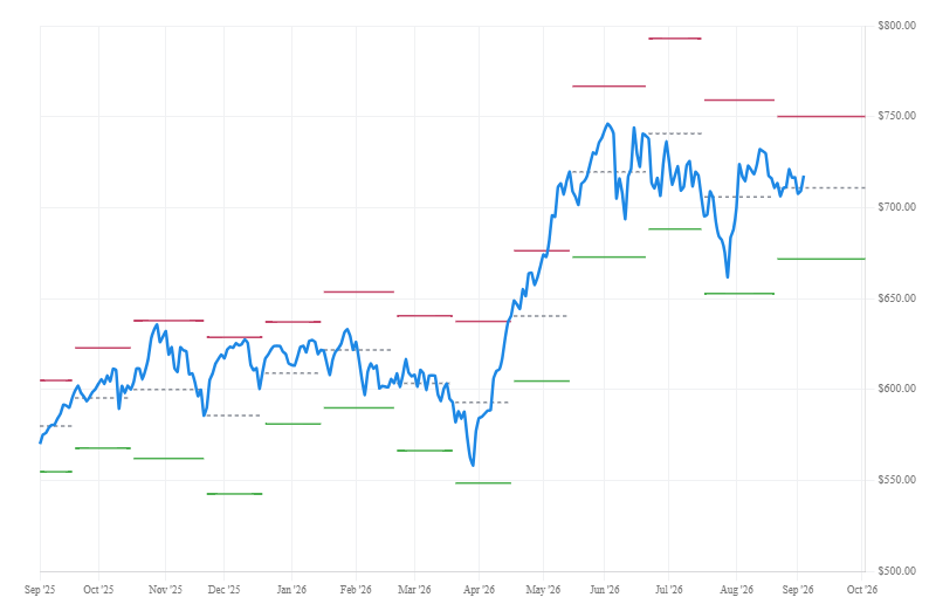
Just consider what the monthly move looks like for the Invesco QQQ Trust (QQQ):
Between those green and red bands on the chart sits a whole world of potential trade setups.
Because the Expected Move is what options traders use to figure out the range a stock moves within — how far the options market expects a stock or ETF to move over a defined period.
On Friday, I gave my readers an in-depth look at one of the biggest upgrades we’ve made to the Masters in Trading Challenge: our new Expected Move Calculator.
Behind the scenes, it’s driven by implied volatility — the market’s forward-looking estimate of movement.
Once that volatility is translated into a time frame, it creates a range:
- Upper boundary = where price is stretched
- Lower boundary = where price is discounted
Roughly 70%+ of the time, price stays inside that given range. For large, liquid names like Apple, that number climbs even higher — often closer to 75%.
For us, those bands don’t just show us a range. They provide a behavioral map that shows us where market makers are adjusting hedges, how liquidity is shifting – and where institutions are looking for profitable exposure right now.
That’s why these levels consistently act like support and resistance. They show us how the market is pricing in risk – and where the biggest bets on volatility are emerging.
This is where we apply one of the simplest rules we teach:
- Upper band → Take profits (“get on prints”)
- Lower band → Look for entries
- Outside the band → Something has changed
Follow that playbook, and the expected move will always give you an objective measure of what’s normal — and what isn’t.
Now, it’s not enough to just know the expected range of the stock.
Smart traders see a consistent move like that and look for a setup that can reward them whether the asset breaks above or below its Expected Move.
And that’s when you start to realize something big – the direction the stocks breaks isn’t the story. Volatility itself is.
This is exactly where the next principle comes into play – positioning.
Where the Real Buying Shows Up
Let’s go back to that QQQ chart I showed you.
Because back in March, a member of our Discord community – Greg (.odd.1.) – spotted something unusual looking at that exact information.
Institutional traders had been quietly accumulating options on the Invesco QQQ Trust over the past few weeks. And the flow suggested that something bigger might be brewing beneath the surface.
All this positioning opened up a solid trading opportunity. But there was one big catch…
Between rising geopolitical tensions involving the U.S. and Iran, shifting liquidity conditions, and sharp swings in tech stocks, the QQQ could easily break in either direction out of its expected move.
So instead of trying to guess the market’s next move, he took a page right out of the Masters in Trading playbook: He hedged the trade.
Specifically, he built a strangle.That’s when you buy a call and a put with different strike prices but the same expiration date.
That strategy lets you position for a large move without needing to predict which direction the stock will go.
That large move Greg was looking for hit much faster than he expected.
Greg bought contracts Monday morning. By the end of the trading day, he was up over 536%!
Strangles are just one of the tools we use here at Masters in Trading.
We also use straddles, spreads, and other setups designed to profit from volatility itself — not just market direction.
And that’s key for us. Betting on direction is just guessing. Gaining exposure to the underlying move itself is what smart traders always do.
This index is just one asset with the kind of volatility the expected move signals us to.
Once you understand the expected move and know how to read this kind of buying, you don’t need headlines to tell you what’s happening — the data tells you.
We always want to see real money stepping in — big, decisive institutional flow — before we put our capital at risk.
That’s why we track unusual options activity. That’s why we study the expected move. And that’s why we always bet on volatility rather than pure direction.
The biggest winners we’ve had over the last year — like the 534% and 700% trades in MP, or the 150%+ gains we locked in on HPE, CAPR and SLB in August — didn’t work because we simply “liked the story.”
They worked because the story lined up with structure, and structure lined up with flow.
And if you’re serious about understanding the environment we’re entering, The Masters in Trading Options Challenge is where you need to be.
The Challenge is where we take everything you’ve learned in my daily LIVEs — fixed risk, thesis-driven exits, laddered entries, defined-duration trades, along with access to objective tools like the Advanced Notice Unusual Options Scanner and my Expected Move Tool — and put it into practice in a structured, step-by-step environment.
That’s the power of real education. And that’s what we do every day inside the Masters in Trading Options Challenge.
If you’re ready to learn the right way — with zero pressure, fixed risk, and a community that supports you — I’d love to see you inside the Challenge.
You’ve got nothing to prove. You’ve just got to be willing to learn.
And once you see how simple it can be, you’ll never look at options the same way again.
Remember, the creative trader wins,
Jonathan Rose,
Founder, Masters in Trading
5 Stocks Our Experts Predict Could Double In the Next Year
By submitting your email, you'll also get a free pivot & flow membership. A free daily market overview. You can unsubscribe at any time.