Listen to the audio version of this article (generated by AI).
Iran peace deal gooses markets… the hidden signal in gold’s surge… what broke the gold run… the structural case that hasn’t moved… and the tool for knowing when to act… keep your eye on crypto miners today
As I write on Monday, the investment markets are surging on news from yesterday that the U.S. and Iran have announced a preliminary peace agreement intended to end nearly four months of conflict.
A memorandum of understanding has been finalized. Both sides have stood down militarily. And critically, the Strait of Hormuz – which carries roughly a fifth of the world’s oil and LNG in normal times – is set to reopen Friday, when the deal is formally signed in Geneva.
The markets aren’t waiting for Friday…
As I write, all three major U.S. stock indexes are up more than 1% with the Nasdaq leading the way, up roughly 3%. Meanwhile, West Texas Intermediate Crude (WTIC) has plunged 5% to $80 a barrel, its lowest level in more than three months. Treasury yields are dropping. And the dollar is pulling back.
Today’s read is straightforward: war premium out, risk-on in. And that framing isn’t wrong. A reopened Hormuz means lower energy prices, lower inflation expectations, and a Fed that has more room to breathe.
But a note of caution is warranted. The deal isn’t signed yet, Israel isn’t a party to it, and the underlying issues – Iran’s nuclear program, sanctions, and regional security – are being pushed into a 60-day negotiating window. So, the risk of a return to conflict over the summer remains.
Still, for today, markets are celebrating. And for good reason – this is genuinely significant news.
Now, while most investors are cannonballing back into the AI trade, there’s another setup that looks even more attractive today…
Gold.
It’s up nearly 3.5% as I write, and the reasons behind that move tell a more interesting story than the one everyone is talking about.
Why gold is surging – and why it matters more than you think
For months, the Iran conflict was gold’s near-term kryptonite.
The logic was counterintuitive but real: surging oil prices drove inflation expectations higher, which pushed Treasury yields up and strengthened the dollar – and gold, which pays no yield, loses its relative appeal in that environment.
Higher-for-longer rates were pressing down on the metal even as the underlying disorder that’s gold’s true engine kept building beneath the surface.
Today, that dynamic is reversing all at once as traders eye a reopened Strait of Hormuz.
Oil is falling. Inflation expectations are dropping. Rate hike odds are declining. And the dollar is weakening. Basically, every one of gold’s short-term headwinds is turning into a tailwind in a single session.
At the same time, the structural forces that drove gold’s historic run – fiscal deterioration, dollar debasement, central bank accumulation – haven’t moved an inch. Those forces operate on a decade-long timeline and weren’t affected by the Iran conflict.
So, today’s gold move isn’t just a peace-deal pop. It’s the market beginning to reprice the yellow metal without the artificial weight of rate fears pressing down on it. That’s a different and more lasting story than what most investors are focused on right now.
To understand where gold goes from here, you need to understand what broke its record run in January – and why the damage may be closer to finished than most people think.
The warning signs were there
From its all-time high of roughly $5,600 on January 29, the yellow metal had fallen to around $4,200 before today’s bounce – a drawdown of nearly 25%.
For an asset that was supposed to benefit from inflation, geopolitical turmoil and fiscal disorder, that’s a jarring result.
Why did it fall so badly?
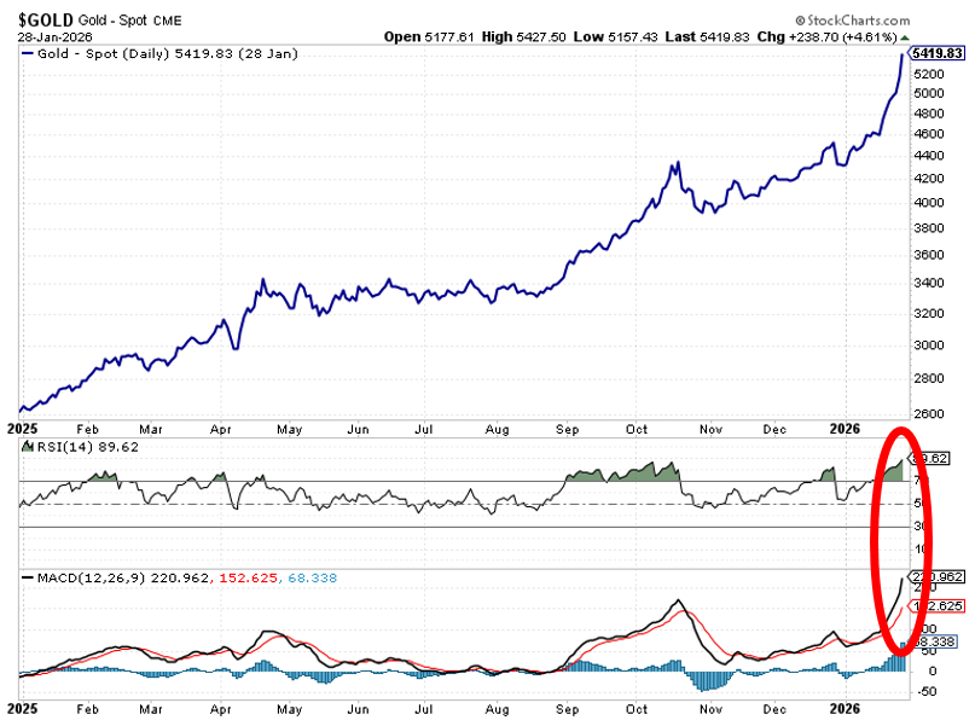
First, gold’s run from mid-2025 through late January 2026 was extraordinary – the metal roughly doubled in about a year, its best annual performance since 1979. By the time it hit $5,600, two technical indicators that traders watch closely were flashing bright red.
The first is the RSI – the Relative Strength Index – which measures whether an asset has been bought too aggressively in a short period. Readings above 70 signal “overbought” territory. As I’ll show you below, at gold’s January peak, the RSI was nearly 90.
The second is the MACD – the Moving Average Convergence/Divergence indicator – which tracks the momentum behind a price move. At the January peak, it reached its highest level in more than a decade, suggesting the move was running out of steam.
Any technical trader looking at gold in late January would have told you a correction was coming. The questions were what would trigger the move, and how deep the ensuing correction would be.

The match that lit the fuse
Two things hit simultaneously on January 30 – and the combination turned a normal pullback into a historic crash.
The first was President Donald Trump’s announcement that Kevin Warsh would become the next Fed Chair, which sent shockwaves through the rates market.
Warsh is widely viewed as an inflation hawk. Markets instantly repriced the rate path: instead of cuts in 2026, suddenly the conversation shifted toward higher-for-longer.
Meanwhile, Treasury yields pushed up. The dollar strengthened. And gold, which pays no yield and competes directly with interest-bearing assets, lost its relative appeal almost overnight.
The second cause is less well known – and frankly, it’s the detail that most financial media missed entirely.
Forced index rebalancing.
Think of a major commodity index like a pie. Each ingredient – oil, copper, gold, silver – is supposed to represent a certain slice. When gold nearly doubled in a year, its slice grew far bigger than the rules allow.
The large index funds that track these benchmarks aren’t permitted to simply let that happen. They’re required to sell gold futures contracts to shrink gold’s slice back to its target size.
This isn’t because they want to, or because they’ve lost faith in gold or its fundamentals. It’s purely because of rules – like a thermostat clicking off when the room gets too warm.
So, when the Warsh nomination landed on the same day, this forced mechanical selling was already underway; the two waves hit at once, which means what looked like a decisive victory from gold bears was, in large part, just a perfect storm of mechanics colliding with a historically overbought asset.
The case that hasn’t moved
Our global macro expert Eric Fry, editor of Fry’s Investment Report, framed the long-term case for gold when he made a gold recommendation to subscribers last year, borrowing a line from financial writer James Grant:
Gold is a bet on monetary disorder – indeed, on other kinds of disorder too, including fiscal, geopolitical and presidential.
Today, despite gold’s drawdown, none of the four disorders Grant identifies have dissipated.
Central banks bought 244 net tonnes of gold in Q1 2026 alone. The U.S. national debt is growing by roughly a trillion dollars every three months. And the dollar’s share of global reserves has declined for two decades.
The market has been pricing the Iran inflation shock. It has not been pricing the decade-long thesis.
Today’s peace deal doesn’t resolve those structural disorders – it simply removes the short-term rate headwind that had been pushing against them. Those are two very different things – and that distinction is exactly why gold’s move today deserves more attention than it’s getting.
Another look at gold’s chart – but updated
A moment ago, I showed you what the technicals looked like at the January peak: the RSI pushing 90, the MACD stretched to an extreme, an asset primed for a fall.
From a technical perspective, we’re in the opposite position today. See for yourself…
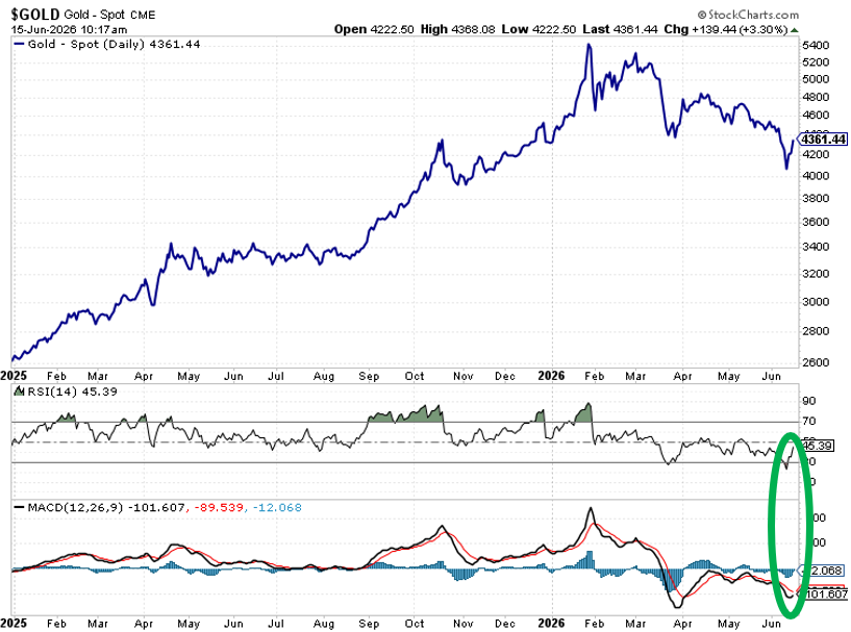
Recently, the RSI briefly touched the high 20s – officially oversold – and is now surging, already back up to 45.
Meanwhile, the MACD is deeply negative but has just U-turned to the north and is climbing back toward its signal line – a bullish movement.
So, the same indicators that screamed “overbought” at $5,600 and were signaling “oversold” just days ago at $4,200 are now signaling a “buying opportunity with room to run” as gold approaches $4,400 today.
To be clear, this is not a guarantee that gold goes straight up from here. And again, the deal isn’t signed yet, and the Iran situation remains highly uncertain. But the technical and fundamental pictures are now pointing in the same direction for the first time since January.
Which raises the most practical question of this entire Digest…
Fundamentals tell you what to own, but timing tells you when to act
The structural case says gold is worth owning at these levels for investors with a longer-term timeframe. And today’s macro shift removes the most powerful near-term headwind the metal has faced all year from a technical perspective.
But “the technicals look better” is not the same as “now is the precise moment.” How does an investor move from analysis to action with data rather than gut feel?
That’s the specific problem that legendary investor Louis Navellier, editor of Growth Investor, and the team at TradeSmith spent the past year solving together.
If you missed our coverage of this last week, Louis has spent 47 years identifying companies with genuine fundamental strength – and his Stock Grader is the quantitative system he built to codify that process.
What the collaboration with our friends at TradeSmith added is a timing layer: a precise, data-driven signal for when the fundamentals are strong enough to act on.
The output is simple – a traffic light. Green means the fundamentals are strong and the technical timing is right. Yellow means hold. Red means stay out or get out.
Here’s Louis:
While my Stock Grader’s main focus is on what stocks to buy, TradeSmith’s Short-Term Health is all about when to buy them.
I’ve been hunting for edges in this market for 47 years. I’ve never seen one like this.
The tie-in to gold is easy…
The fundamental case for owning gold right now is strong – discounted 20% from its high, with structural forces intact and shorter-term technical indicators flashing green.
But knowing the fundamental/technical case and knowing the right moment to pull the trigger are two different skills. Louis and TradeSmith built a system for exactly that second skill.
One final corner of the market worth your attention today…
Bitcoin mining stocks are having a remarkable year, with a tracked basket up more than 50% in 2026 even as Bitcoin itself cratered. And they’re surging today as investors jump back into the market.
How is this happening if Bitcoin has crashed?
Because Bitcoin miners have been pivoting from selling hash to selling power, positioning themselves as landlords for the AI buildout.
As veteran trader Jonathan Rose puts it, it’s the same substation, same transformer – just a different tenant.
The reality is that today, Wall Street values a megawatt of power used to run AI chips at a dramatically higher multiple than the same megawatt used to run bitcoin mining equipment.
So, the companies making that switch are being re-rated from “speculative hash factory” to “critical AI infrastructure” in real time. And this is creating massive momentum in related stocks.
Jonathan will be breaking down six mining stocks at the center of this $90 billion AI pivot in tomorrow’s Masters in Trading Live episode.
In these free MIT Live videos, he profiles market trends, explains entries and exits, and discusses the opportunities he’s watching in real time. He does this every day the market is open at 11 a.m. ET. You can sign up right here.
Bottom line: If the mining-to-AI pivot is new to you, tomorrow’s video is the right place to start – Jonathan will walk through where it goes from here and how much runway these stocks still have.
Coming full circle
The gold bull market didn’t end in January. It got reset by a hawkish Fed surprise, mechanical index selling, and an oil shock that temporarily made inflation the bigger story than disorder.
Today’s peace deal removes the biggest of those headwinds. But the decade-long forces driving the bull case for gold – fiscal deterioration, dollar debasement, central bank accumulation – haven’t moved an inch.
Invest accordingly.
Have a good evening,
Jeff Remsburg
5 Stocks Our Experts Predict Could Double In the Next Year
By submitting your email, you'll also get a free pivot & flow membership. A free daily market overview. You can unsubscribe at any time.