Three consecutive months of year-on-year growth in Europe, including a 46.5% rebound in April 2026 to 10,654 regional units, mark a clear improvement after a severe 2025 slump that saw EU registrations fall 37.9% and market share halve to 1.3%.
The recovery is real — but BYD registered 27,008 units in Europe during the same month, more than doubling year on year, and the structural dynamics of that gap define the limits of what the ACEA data can confirm.
|
$432.33 TSLA Price As of May 26, 2026 |
+44.4% 52-Week Return vs $273.21 low |
$498.83 52-Week High vs $273.21 Low |
+46.5% Europe Apr YoY 10,654 units (ACEA) |
+67.2% EU-Only Apr YoY 9,169 units (ACEA) |
$22.4B Q1 2026 Revenue +16% YoY (Tesla IR) |
21.1% Gross Margin Q1 Auto incl. credits |
~$55.4 RSI (14) Neutral territory |
What the April Data Shows — and What It Does Not
registered 10,654 vehicles across the European Union, the United Kingdom, Iceland, Liechtenstein, Norway and Switzerland in April 2026, according to data published by the European Automobile Manufacturers’ Association (ACEA). That represents a 46.5% increase over the same month in 2025, when the company was absorbing both a full Model Y production transition and the peak of consumer backlash linked to CEO Elon Musk’s involvement with the Trump administration. In the EU alone, registrations grew more than 67% to 9,169 units.
The April result extends a sequence that began in February 2026, when ACEA data showed Tesla’s first year-on-year gain in European registrations since December 2024 — an 11.8% improvement to 17,664 regional units. March followed with a gain of more than 84%, and April has now confirmed a third consecutive month of positive territory. Across the first quarter, Tesla delivered approximately 78,000 vehicles in greater Europe, a roughly 45% year-on-year increase, with the Model Y returning as Europe’s best-selling vehicle in March before finishing second for the full quarter (Drive Tesla Canada, ACEA).
The year-on-year comparisons, however, remain distorted by the depth of the 2025 decline. Tesla’s full-year EU registrations fell 37.9% in 2025 to 150,504 units, according to ACEA’s final annual print. The company’s market share in the EU fell from 2.2% to 1.3% over the same period. April 2025 specifically was among the weakest months of that stretch — the fourth consecutive month of declines, with registrations down 49% year-on-year and EU market share at just 0.7% — which makes the April 2026 comparison arithmetically favourable regardless of absolute volume trajectory.
Country-level data collected by Reuters shows the recovery is geographically uneven. France recorded a 112% surge, Denmark 102%, and Sweden 111%. The Netherlands, which approved the use of Tesla’s driver-assistance software via regulator RDW in April — with notification to the European Commission for potential EU-wide recognition — rose 23%. Norway, historically Tesla’s strongest per-capita market, fell 61% year-on-year, driven by a January 2026 reduction in the VAT exemption threshold from 500,000 to 300,000 Norwegian crowns, below the starting price of both the Model Y and Model 3. Spain declined 47%, Italy 5%, and Portugal 33%.
Section 2 — Technical Snapshot
|
Price (May 26) |
$432.33 |
52-Wk High / Low |
$498.83 / $273.21 |
|
SMA 50 |
~$418.50 |
SMA 200 |
~$394.22 |
|
RSI (14) |
~55 (Neutral) |
MACD |
Positive / Signal above |
|
Support Zone |
$390–$403 |
Resistance Zone 1 |
$424–$428 |
|
Resistance 2 |
$443–$449 |
52-Wk Return |
+44.4% |

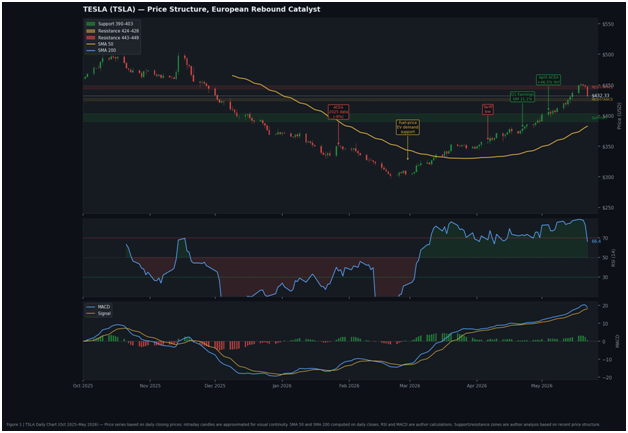
Figure 1 | TSLA Daily Chart (Oct 2025–May 2026). Price series based on daily closing prices; intraday candles are approximated for visual continuity. SMA 50 and SMA 200 computed on daily closes. RSI and MACD are author calculations. Support/resistance zones are author analysis based on recent price structure.
TSLA’s price structure from October 2025 through late May 2026 traces a full corrective cycle — from a 52-week high of $498.83 through a trough near $273.21 in the January–February 2026 period, followed by a multi-month base and a recovery now approaching the lower boundary of the first structural resistance cluster at $424–$428. The price is currently pressing against that zone and the SMA 50, which sits at approximately $418.50; a sustained close above both would shift the near-term technical posture from recovery to breakout attempt, with the next resistance band at $443–$449. RSI(14) at approximately 55 sits in neutral territory — neither overbought nor generating the kind of divergence that preceded the late-2025 sell-off — and the MACD line holds above its signal line with positive histogram bars, consistent with a momentum regime that supports rather than challenges the directional trend. The $390–$403 zone represents dual-timeframe support formed from the convergence of the SMA 200 (~$394) and prior consolidation lows; it is the level a macro reversal — a softer European registration print or a Q2 delivery miss — would need to reclaim to challenge the recovery thesis. The April ACEA data gives the recovery a cleaner fundamental anchor, but confirmation still depends on May, June and Q2 delivery data.
The Structural Forces Behind the Recovery
Two forces help explain the European EV acceleration in early 2026. The first is price-driven demand substitution: the February 28 outbreak of armed conflict involving Iran pushed European fuel prices sharply higher, compressing the total-cost-of-ownership gap that had previously made petrol and diesel vehicles competitive with battery-electric alternatives across many market segments. Battery-electric vehicles accounted for 20.5% of all new car registrations across Europe (EU, UK and EFTA) in Q1 2026, up from 13.2% in the same period a year earlier (Reuters); the EU-only figure stood at 19.4% (ACEA). This represents a structural demand shift that benefits the entire EV segment — not Tesla specifically — but Tesla’s volume concentration in the BEV-only category means it captures a disproportionate share of any BEV-specific acceleration.
The second is comparison base mechanics compounded by product availability. Tesla’s production shutdown across all four global factories for the Model Y Juniper refresh in early 2025 depressed the base materially. The refreshed Model Y, which launched in Europe in April 2025 and failed to immediately reverse the brand-sentiment headwind, is now cycling through its first full year of European availability — enabling volume that the 2025 period was structurally unable to generate. Q1 2026 revenue reached $22.39 billion, up 16% year-on-year, with automotive gross margin at 21.1% including regulatory credits and 19.2% excluding them, the highest quarterly margin figure since before the aggressive price-cut period of 2023 (Tesla Q1 2026 10-K filing via SEC EDGAR).
The FSD approval process adds a regulatory option-value layer to the recovery. The RDW approval for driver-assistance software in the Netherlands is currently valid only in that market; RDW has notified the European Commission of its intent to seek EU-wide recognition, which would require additional regulatory steps before broader applicability. FSD has also expanded to Lithuania (Reuters). The approval represents a shift in the regulatory posture that had previously blocked one of Tesla’s primary value-differentiation levers, but EU-wide clearance remains a forward-looking variable rather than a confirmed outcome. FSD monetisation in Europe remains on a subscription basis; paid subscriber growth rate was not disclosed in Q1 earnings, but the addressable base expands with each new national approval.
The 46.5% year-on-year rebound in April European registrations reflects a combination of base effects, fuel-price-driven EV adoption, and incremental regulatory clearance — not a reversal of the structural competition dynamic that allowed BYD to register more than twice Tesla’s regional unit volume in the same month.
The Competitive Gap That the Recovery Does Not Close
BYD registered 27,008 vehicles across Europe in April 2026, more than doubling year-on-year, and Leapmotor — the Stellantis-controlled Chinese brand — posted a fivefold increase to 8,745 units. BYD’s quarterly EU registrations reached 50,646 vehicles in Q1 2026, up 169.7% year-on-year, lifting its EU market share to 1.8% (ACEA). Including the UK and EFTA, BYD’s Q1 total reached approximately 73,847 units at a market share of 2.1%, compared with 0.9% in Q1 2025 (EV.com). Tesla’s EU market share, while recovering from the April 2025 low of 0.7%, remains well below the 2.2% it commanded in 2024.
The asymmetry has product-structural roots. Tesla sells two mass-market models — the Model 3 and Model Y — across a market that BYD now addresses with a broadening range of BEV and plug-in hybrid vehicles spanning multiple price points. The Seal U DM-i was the best-selling plug-in hybrid in Europe in 2025; BYD’s newly revealed Dolphin G DM-i, designed specifically for European market tastes, is priced to enter at under £20,000 in the UK and is scheduled for delivery by year-end. BYD also registered 4,705 vehicles in Germany in April alone, tripling its monthly volume and crossing the 4,000-unit threshold for the first time in Europe’s largest automotive market (EV.com, KBA data). Tesla has not launched a new mass-market vehicle since the Model Y in 2020.
On the financial sustainability of that competitive pressure: BYD’s net profit fell 55% in Q1 2026 as a domestic price war in China compressed per-vehicle earnings by as much as 66% (CNBC, BigGo Finance). Overseas margins remain higher and export volumes are rising — Q1 2026 saw BYD ship 319,751 overseas passenger vehicles and pickups, a 65.2% year-on-year increase. The combination of margin erosion at home and capacity deployment abroad creates a strategic incentive for BYD to prioritise European volume over European profitability in the medium term, maintaining competitive pricing pressure on Tesla across precisely the market segments where the April recovery is most visible.
Tesla’s Giga Berlin-Brandenburg investment plans reinforce a longer-horizon posture. The company has announced approximately $250 million in capital allocation to the facility, with the investment primarily directed toward battery cell production capacity alongside hiring and infrastructure expansion. The plant is targeting one million vehicles built on site as its long-term milestone and had reached 750,000 cumulative vehicles at the time of the announcement. Localised production in the EU provides structural cost and regulatory advantages versus imported Chinese vehicles still subject to EU additional tariffs, but the production ramp timeline extends the competitive benefit beyond the near-term revenue quarter.
Section 5 — Scenario Framework
|
SCENARIO |
CATALYST / TRIGGER |
DIRECTIONAL BIAS |
|
Bearish |
European rebound stalls — May or June ACEA data prints flat or negative YoY as political brand risk re-emerges. Fuel prices ease, reducing EV tailwind. SMA 50 (~$418) fails to hold; price slides toward the $390–$403 support zone. BYD sustains volume lead across all major EU markets. |
TSLA faces downward pressure toward the $390–$403 support band. A breach of that zone risks exposing the $347–$349 structural level. |
|
Base Case |
European registrations hold in the 35–55% YoY range through Q2 2026. FSD regulatory approvals spread from the Netherlands across additional EU states. Q2 2026 deliveries come in at or above the 375,000 consensus. Price consolidates between SMA 50 (~$418) and the $443–$449 resistance zone with no decisive breakout. |
TSLA likely to trade in the $418–$445 range. Momentum indicators remain constructive but not strongly directional. Dip-buying interest may reappear near the SMA 50 (~$418) if the overall recovery narrative holds. |
|
Bullish |
ACEA April full-region data confirms the 46.5% headline, reinforced by May prints above 50% YoY. EU-wide FSD approval progresses materially toward Q3 2026. Q2 2026 deliveries beat 380,000 units. Cybercab ramp at Giga Texas scales ahead of schedule, and capex guidance is revised lower. |
A sustained close above the $443–$449 resistance cluster would open a technical path toward the 52-week high at $498.83. MACD positive divergence supports the directional case. |
What to Watch
The April ACEA print establishes a third consecutive month of year-on-year growth in European registrations, which is sufficient to show that Tesla has moved out of the worst phase of its 2025 European slump. It is not, by itself, sufficient to confirm whether the company is rebuilding sustainable market share or benefiting from a transient combination of base effects, fuel-price-driven EV demand, and availability normalisation following the Model Y transition. The answer to that question will emerge from the next two to three monthly ACEA releases and from Q2 2026 global delivery data due in early July.
On the technical side, the most informative near-term variable is whether TSLA can close above the $424–$428 resistance cluster on sustained volume. The SMA 50, currently at approximately $418.50, has crossed above the SMA 200 (~$394.22), establishing a golden cross structure that is constructive for medium-term trend direction. However, the RSI at approximately 55 and MACD at early-stage positive divergence indicate that momentum has not yet generated the kind of accumulation conviction that drives sustained breakouts above multi-month technical barriers. A rejection at the current resistance zone, particularly if accompanied by a weak ACEA May print or Q2 delivery shortfall, would re-test the $390–$403 support confluence.
The regulatory calendar matters structurally. European Commission action on the Netherlands FSD notification — either approval or delay — could either expand Tesla’s addressable premium subscriber base across the bloc or cap it. Capex of more than $25 billion committed for 2026, with Cybercab ramp, Optimus production, and Robotaxi expansion as the primary allocations, ensures that near-term free cash flow will remain constrained even as automotive gross margin recovers. The July 22, 2026 Q2 earnings date is the next hard convergence point for all of these variables.
Disclaimer: This article is for informational purposes only and does not constitute investment advice, a solicitation, or a recommendation to buy or sell any security. The views expressed are the author’s own and do not represent those of any affiliated institution. Past performance is not indicative of future results. Readers should conduct their own due diligence before making investment decisions.
5 Stocks Our Experts Predict Could Double In the Next Year
By submitting your email, you'll also get a free pivot & flow membership. A free daily market overview. You can unsubscribe at any time.