was flat on the day, finishing up just 2 bps. Overall, it was a bit of a snooze fest. The main takeaway is that today begins a nearly $150 billion liquidity drain, starting with $15 billion in T-bills settling, followed by $47 billion in coupon settlements on Friday, $68 billion on Monday, and another $16 billion in T-bill settlements on Tuesday. There should also be another T-bill settlement on June 4, in the roughly $5 billion to $15 billion range.
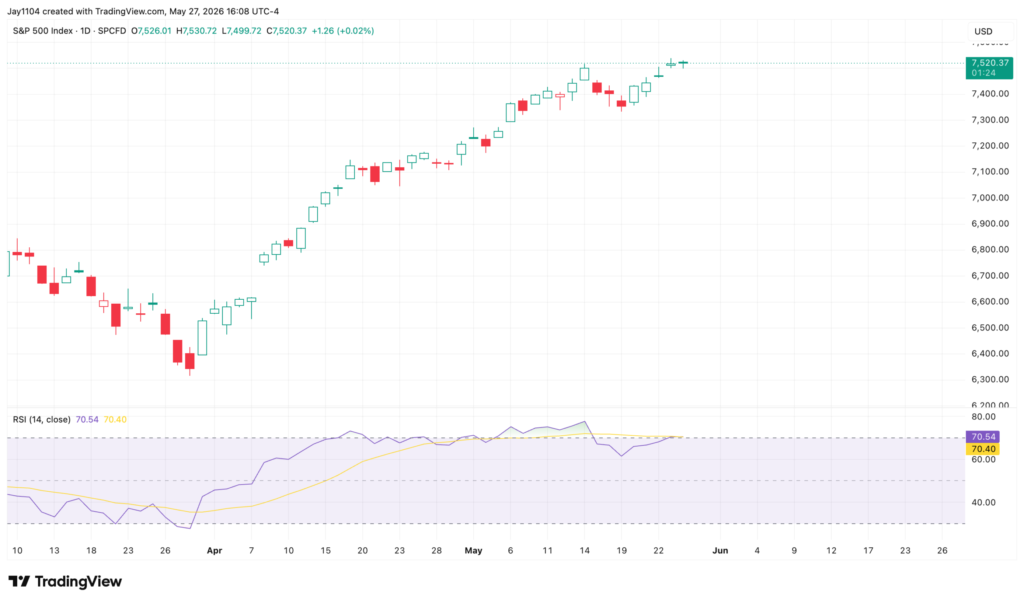
The point is that since the calendar flipped from paydowns to net issuance on May 12, the index has risen by around 1.8%. However, most of those gains came on May 13 and 14, with the index otherwise largely stalling around the 7,515 region.
Meanwhile, over that same period, is down roughly 7% to 8%. More importantly, it is sitting on support around $75,000, and a break below that level could set up a move towards $70,000. That is something worth watching because, in my experience, Bitcoin tends to be a better liquidity indicator than most other instruments. If the Treasury settlements are a drain on liquidity, then Bitcoin could be heading much lower.
In the meantime, the weighted average repo rate was 3.66%, and I would expect SOFR to either remain flat or move higher again when today’s data arrives at 8 AM ET. As I have noted before, I think the sharp decline in SOFR was driven mostly by the Treasury’s bill paydowns, which likely created cheaper financing conditions as equity repo positioning surged over the past couple of weeks.
Unfortunately, equity repo activity data is delayed by about a week, making it difficult to track accurately in real time.
Otherwise, we can just wait to see how things go today.
5 Stocks Our Experts Predict Could Double In the Next Year
By submitting your email, you'll also get a free pivot & flow membership. A free daily market overview. You can unsubscribe at any time.