- Markets rebounded despite hawkish Fed signals, supported by falling oil prices and AI optimism.
- Investors now expect economic data to play a larger role in shaping Fed policy.
- S&P 500 remains at a key technical crossroads, with 7,500 acting as critical support.
After the FOMC-driven sell-off, US index futures bounced back overnight along with firmer European markets, although the dollar extended its gains which kept the pressure on foreign currencies and gold. Equity market investors are now weighing the AI trade optimism and lower energy prices against a clear hawkish shift from the Fed.
While the FOMC was split about whether they will or not this year, this was still a sharp change from their previously dovish stance. That said, the big drop in energy prices over the past few days is certainly good news, and this may see the Fed opt for an extended pause instead of tightening.
One thing is clear: the market will now be a lot more sensitive to incoming data again. For now, the stock market bulls still have the upper hand. However, there is an increased risk that the market could unravel amid the lack of any meaningful new catalysts and as the FOMC has turned a little more hawkish. With valuation concerns still at the back of investors’ minds, a bout of profit-taking or a mini correction cannot be ruled out at this stage.
FOMC Was Hawkish
Kevin Warsh’s debut as Federal Reserve chair delivered a distinctly hawkish message, underpinning the and initially unsettling equity markets before a rebound emerged overnight. The Fed’s firm emphasis on price stability, together with a more hawkish shift in the dot plot projections, proved to be the key drivers of the market reaction.
With nine of the 18 policymakers now expecting at least one rate increase this year, the Committee appears ready to act should inflation begin to drift higher again. In the absence of meaningful forward guidance from either the abbreviated FOMC statement or Warsh’s press conference, incoming economic data will assume greater importance in shaping the policy outlook.
My view remains that inflation is likely to ease modestly later this year, allowing the Fed to remain on hold rather than resume tightening.
Attention today will turn to weekly and the Philadelphia Fed business outlook survey. While stronger economic data could create some near-term headwinds for equities by reinforcing higher-for-longer rate expectations, I do not view this as the catalyst for a major market correction. That is particularly true given the supportive backdrop from lower energy prices and generally constructive risk sentiment.
Crude Oil Eases Further
One of the key drivers behind the recent rally has been the sharp drop in energy prices. fell for the sixth day this morning, and this kept the markets largely on the front foot.
With much softer crude oil prices compared to just a couple of weeks ago, this should continue to ease global concerns over inflationary pressures and may ease the Fed’s hawkish rhetoric.
For equity investors, falling oil prices are music to their ears. Lower energy costs not only improve profit margins for businesses but also reduce the likelihood of additional monetary tightening from major central banks.
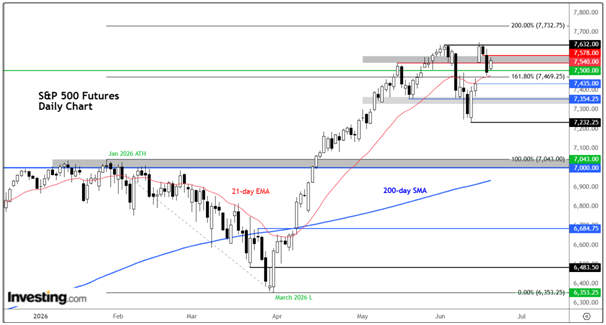
S&P 500 Technical Analysis
The have bounced back from the 7,500 area following the FOMC’s hawkish policy decision yesterday.
For now, the index appears to be finding renewed support, but we are now at a prior support and resistance zone between 7,540 and 7,578. This area was previously the support, and we could see it turning into resistance in light of yesterday’s bearish close.

Still, for me to turn bearish, we will need to see some downside follow-through. So watch the 7,500 level closely today. If we go below that level, things could start to turn a little more bearish once again.
Don’t forget that the gap created at the opening this week following the U.S.–Iran deal has not been closed yet. Friday’s closing level comes in at 7,435, so that could be another support level to watch.
The next support below that is 7,354, which was a prior support level reclaimed during the latest rally. That level is now the line in the sand for me as far as the short term is concerned. If we go below that level, then things could turn a little bit bearish, with the next downside objective becoming the liquidity below last week’s low at 7,232.
From there, we could see the index potentially head back down to the long-term support area around 7,000. So that risk remains on the table as well.
On the upside, if we break above the aforementioned 7,540–7,578 resistance zone, then we could see the index move back toward the recent highs around 7,632 to 7,648.
Thereafter, we have the 200% extension of the January-to-March decline coming in at 7,732, which is the extended bullish objective for me at this point.
***
Below are the key ways an InvestingPro subscription can enhance your stock market investing performance:
- ProPicks AI: AI-managed stock picks every month, with several picks that have already taken off this month and in the long term.
- Warren AI: Investing.com’s AI tool provides real-time market insights, advanced chart analysis, and personalized trading data to help traders make quick, data-driven decisions.
- Fair Value: This feature aggregates 17 institutional-grade valuation models to cut through the noise and show you which stocks are overhyped, undervalued, or fairly priced.
-
1,200+ Financial Metrics at Your Fingertips: From debt ratios and profitability to analyst earnings revisions, you’ll have everything professional investors use to analyze stocks in one clean dashboard.
-
Institutional-Grade News & Market Insights: Stay ahead of market moves with exclusive headlines and data-driven analysis.
-
A Distraction-Free Research Experience: No pop-ups. No clutter. No ads. Just streamlined tools built for smart decision-making.
-
Vision AI: InvestingPro’s newest addition. It analyzes any asset’s chart with professional-grade market intelligence, identifying key timeframes, technical patterns, and indicators — then delivers a clear trading playbook with the levels, scenarios, and risks that matter most in under a minute.
Not a Pro member yet?
Disclaimer: This article is written for informational purposes only; it does not constitute a solicitation, offer, advice, counsel or recommendation to invest as such it is not intended to incentivize the purchase of assets in any way. I would like to remind you that any type of asset, is evaluated from multiple perspectives and is highly risky and therefore, any investment decision and the associated risk remains with the investor.
5 Stocks Our Experts Predict Could Double In the Next Year
By submitting your email, you'll also get a free pivot & flow membership. A free daily market overview. You can unsubscribe at any time.