The MisreadThe financial technology infrastructure that banks and asset managers rely on to operate their wealth platforms, administer their funds, process their trades, and service their institutional clients is not a glamorous business. It does not generate the kind of headline growth that attracts multiple expansion. It does not lend itself to simple descriptions. has spent fifty years building exactly that kind of business, and the market has spent the better part of the last decade pricing it as though it were something considerably less durable.
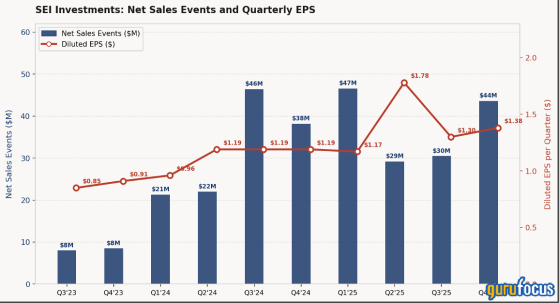
At roughly $90 per share, the company trades at approximately 16 times its 2025 earnings of $5.63 per diluted share. The stock has moved up from the low $80s since the Q1 2026 results were reported on April 22, when SEI delivered revenue of $622.2 million, up 13% year over year, diluted EPS of $1.40, up 20%, and an adjusted operating margin of 32%. Net sales events for the quarter reached $67.2 million, shattering the prior quarterly record by more than 40%. The trailing multiple has narrowed toward the ten-year average of 18.7 times, but the forward multiple, based on where the annualized earnings run rate is heading, remains closer to 14 times. These are not projections.
The honest response to the remaining discount begins with history. From 2017 through 2022, SEI grew EPS at roughly 7% per year, a rate that is adequate but not exceptional for a business claiming 25% returns on invested capital.Stock-based compensation, running at $27 to $46 million annually across that period, partially offset the share count reduction from buybacks, meaning the true per-share accretion from capital returns was lower than the headline buyback figures suggested. The private banking segment, the company’s largest revenue contributor, was losing clients and generating mid-single-digit operating margins, absorbing capital and management attention that produced little visible return. The market priced a business that generated high reported returns but translated those returns into moderate per-share growth, and at a 14x multiple, it was not obviously wrong to do so.
The question is whether the next five years will look like the last five. The evidence from the past eight quarters, confirmed again in the Q1 2026 results, suggests a structural change in the rate at which returns translate into per-share earnings. Net sales events have gone from $69 million in full-year 2022 to $149.9 million in 2025 to an annualized run rate of $269 million based on Q1 2026’s $67.2 million. Private banking operating profit grew 40% in Q1 2026 and the segment’s margins reached 23%, more than four times the level they ran at three years ago. Full-year 2025 SBC of approximately $55 million against $616 million in buybacks means stock compensation absorbed less than 10% of the repurchase budget, a ratio that has improved as earnings growth has pulled more option vesting targets into reach. The share count declined from 131.2 million at the end of 2023 to 121.0 million by March 2026, a genuine 8% reduction in a little over two years. The business producing those returns is structurally different from the one the market learned to discount.
What the Platform Does
SEI operates across four segments that together describe a financial technology and investment outsourcing franchise, not a traditional asset manager. Investment Managers provides fund administration, middle office services, and compliance infrastructure to alternative asset managers, hedge funds, and private equity firms, a client base that has driven the fastest organic growth in the business as alternatives have expanded and the complexity of fund operations has outpaced what most managers want to handle internally. Private Banks provides the SEI Wealth Platform, a cloud-based core banking and wealth management system deployed by regional banks, credit unions, and global financial institutions to run their private client operations. Investment Advisors is the RIA and broker-dealer platform that provides asset management, portfolio management tools, and separate account capabilities. Institutional Investors serves pension plans, endowments, and sovereign wealth funds with outsourced chief investment officer services.
The common thread is outsourcing. A bank that runs its private wealth operation on SEI’s platform pays SEI instead of building and maintaining its own technology, compliance, investment operations, and reporting. An alternative manager that uses SEI for fund administration pays SEI instead of hiring the team and maintaining the regulatory systems. The fee is recurring and grows as client assets grow without additional sales effort. Roughly 80% of total revenue comes from management, administration, and distribution fees tied to the value of client assets. The rest is technology and professional services, also predominantly recurring.
The financial profile is more technology platform than fund manager. In 2025, operating cash flow reached $607.7 million on $2.3 billion of revenue. Return on invested capital has risen from approximately 17% in 2022 to 25% today, driven by higher-margin revenue flowing across a largely fixed cost base. The balance sheet holds $400 million in cash against $28 million of debt. Management returns 90 to 100% of free cash flow through dividends and buybacks.
The Private Banking Inflection
For years, the private banking segment was the most visible constraint on SEI’s overall re-rating. The business generated single-digit or negative net sales events, meaning it was losing more in client cancellations than it was winning in new business. Operating margins, which the stronger segments routinely ran above 30%, sat at mid-single digits for extended periods. The criticism was structural: the SEI Wealth Platform required heavy customization, long implementation cycles, and a support model that produced client friction rather than the kind of sticky low-maintenance relationship that drives financial technology valuations.
The turnaround that CEO Ryan Hicke has overseen since taking over from founder Alfred West in 2022 began with a specific operational decision: standardize the platform, reduce customization commitments, and migrate existing clients from legacy configurations onto a more uniform cloud architecture that SEI could maintain and upgrade at scale. That shift reduced friction in new client implementations and freed up resources that had been consumed servicing idiosyncratic client builds. The backlog of contracts signed but not yet converted onto the platform, one of the most reliable forward indicators of revenue in this business, began to grow.
In Q4 2025, private banking generated $27.5 million in net sales events, the segment’s largest quarterly contribution in SEI’s history and the primary driver of the company’s $43.6 million all-time quarterly record. The wins reflected demand across the full suite of SEI’s capabilities: SWP software-as-a-service, implementation services, and enterprise-wide professional services from institutions that range from super-regional US banks to global financial services firms. Operating margins in the segment expanded to 19% in Q4, up from 16% the prior quarter, driven by cost leverage and higher-margin professional services associated with recent wins. That is not yet the 25 to 30% margins the Investment Managers segment runs at, but the direction is clear and the mechanics behind it are reproducible.
The timing matters for owners. Net sales events measure contracts signed, not revenue recognized. Revenue begins once clients convert onto the platform and assets go live, typically six to eighteen months later. The record $149.9 million in 2025 net sales, followed by $67.2 million in Q1 2026 alone, represents future recurring revenue that has mostly not yet appeared in any income statement. A business where the leading indicator has more than tripled in three years while the trailing multiple reflects the period when private banking was a drag is offering a gap between what the market sees and what the income statement will soon reflect.
Capital Deployed at ScaleSEI’s capital allocation record is one of the more striking in the financial technology sector. In 2025, the company repurchased 7.5 million shares for $616 million at an average price of approximately $82 per share, reducing shares outstanding by nearly 6% in a single year. Combined with $124 million in dividends paid, total capital returned to shareholders reached approximately $740 million, against operating cash flow of $607.7 million. The slight excess over cash flow in the year reflects the decision to also fund the $440.8 million Stratos acquisition primarily from the balance sheet, leaving year-end cash at $400 million with no long-term debt.
The Stratos acquisition deserves examination as a capital allocation signal rather than simply a product extension. Stratos is a registered investment adviser platform operating across multiple business models and affiliation structures, the kind of aggregator that has grown rapidly as independent financial advisors consolidate away from wirehouses and into RIA structures. SEI paid $440.8 million for the first and largest close of the deal in Q4 2025, funded entirely from existing cash, with further roll-up acquisitions under the Stratos platform planned as the relationship develops. The strategic rationale is straightforward: SEI already provides asset management, investment processing, and technology to the RIA channel through its Investment Advisors segment. Owning an advice platform in that same channel puts SEI closer to the advisor and the end client, turning a vendor relationship into an operating partnership and giving the company direct access to client data that sharpens product design across every business unit.The $440.8 million acquisition is SEI’s largest in at least a decade and represents approximately 4.4% of the company’s current market capitalization.
The $650 million share repurchase authorization increase approved by the board in October 2025 brought total available authorization to approximately $773 million before the Q4 repurchase activity. Management has consistently framed buybacks as a capital allocation decision rather than a mechanical distribution program, repurchasing aggressively when the stock has traded below what they assess as intrinsic value. In 2025, the company repurchased shares at an average of approximately $82 per share. The stock has since moved to $90, which means the 2025 buyback program is already accretive to remaining shareholders at the current price. A business with 25% ROIC, record net sales, and $400 million of net cash that repurchases 6% of its float in a single year at prices below where the stock trades today has demonstrated both conviction and discipline.
What an Owner Earns Here
The honest version of the owner math starts with what went wrong before. From 2018 through 2022, diluted EPS grew from $3.14 to $3.46, a compound rate of roughly 2% per year. During that same period, SEI repurchased billions of dollars in stock, but stock-based compensation running at $27 to $46 million annually partially offset those buybacks, and the private banking segment consumed management capital and energy without producing commensurate earnings growth. An owner who bought SEI in 2018 at $72 per share and held through May 2026 at $90 earned roughly 25% total over eight years, plus dividends. That is not a record that justifies a premium multiple, and the market is not irrational for having assigned a lower one for most of that period.
What has changed is measurable. In the past three years, EPS has gone from $3.46 in 2022 to $5.63 in 2025, a compound rate of 18% per year. Q1 2026 continued at 20%. The difference is not buybacks alone; the operating business is growing faster because the private banking segment has stopped destroying value and started creating it, and the investment managers segment is winning large alternative manager mandates at a rate that did not exist before the platform standardization.
Stock-based compensation in 2025 ran at approximately $55 million, still meaningful but now less than 10% of the $616 million repurchase program, a ratio that has improved as vesting targets are reached earlier against accelerating earnings. The share count has fallen from 131.2 million at the end of 2023 to 121.0 million by March 2026. The question for a prospective owner is not whether the past was disappointing, which it was, but whether the 18% EPS growth of the past three years better reflects the business’s normalized earning power than the 2% of the five years before it. The net sales backlog, which has more than tripled in three years and hit a new quarterly record in Q1 2026, is the most direct evidence that it does.
CompanyFwd P/EROICFCF YieldDebt/Equity
| SEI Investments | ~14x | 25% | ~5.9% | 0.01x |
| ~25x | 13% | ~3.5% | ~1.4x | |
| ~15x | ~9% | ~7.0% | ~1.1x | |
| T. Rowe Price | ~12x | 35% | ~8.0% | 0x |
The compression in SEI’s forward multiple relative to Broadridge, the most relevant structural analog, is still approximately 11 points of forward P/E for a business that operates with higher ROIC, lower leverage, more proprietary platform revenue, and a record backlog converting through 2026 and 2027.
The clearest evidence that this improvement is operational rather than market-driven sits in the relationship between revenue and platform assets. In Q1 2026, revenue grew 13% while assets under administration grew 4%. The gap reflects two things the AUA figure alone cannot capture: new clients converting onto the platform and generating fees for the first time, and existing clients purchasing additional services, from professional services to compliance infrastructure, that increase the revenue SEI earns per dollar of administered assets. Consolidated operating margin expanded from roughly 22% in 2022 to 32% adjusted in Q1 2026, a pace that cannot be explained by asset appreciation alone. Rising markets lift the revenue line, but they do not cut costs, compress implementation timelines, or win professional services mandates that did not previously exist. Those are operating improvements, and they show up in the margin data quarter after quarter regardless of what equity markets do in any given period.
Broadridge Financial, the most direct functional analog in terms of serving financial institutions with outsourced technology and operations, trades at approximately 25 times forward earnings against SEI’s 14 times. Broadridge generates 13% ROIC and carries 1.4 times debt to equity. SS&C Technologies, which administers funds and wealth management platforms for similar clients, trades at approximately 15 times on a non-GAAP adjusted earnings basis and generates 9% ROIC against debt of 1.1 times equity. , the most directly labeled peer in the traditional asset management framing, generates 35% ROIC and trades at 12 times, but carries no debt and is overwhelmingly a pure investment management franchise without the platform and outsourcing dimension. The specific compression in SEI’s multiple relative to Broadridge, the most relevant structural analog, is approximately 11 points of forward P/E for a business that operates with higher ROIC, lower leverage, more proprietary platform revenue, and a record backlog converting through 2026 and 2027.
At $90 per share, the trailing free cash flow yield is approximately 5.6%. The share count is declining at 5 to 6% per year. If earnings grow at even the lower end of the post-2022 trajectory, say 12 to 15% annually rather than the 18% realized over the past three years, the total annualized return to an owner from here sits in the mid-teens without any change in the multiple. The trailing multiple at 16 times has already narrowed toward the five-year average of 16.8 times, meaning the easy re-rating gain has largely played out. What remains is the forward multiple, which at roughly 14 times 2026 earnings still sits meaningfully below where a business with this growth rate and return profile would normally trade. The return from here is driven primarily by the earnings themselves, not by the multiple expanding to something generous. For a business compounding per-share earnings at 15% or better, that is sufficient
Investors
Chuck Royce (Trades, Portfolio)’s Royce Associates holds 906,000 shares representing $74.3 million, the largest hedge fund position visible in the ownership data, accumulated at an average cost near $52.80 per share, a gain of more than 50% from the average entry. The position has been held through multiple cycles, and the 0.31% addition of 2,800 shares in the most recent period is less significant than the sheer duration of the holding, which reflects a conviction about the business’s durability rather than a tactical trade around near-term catalysts. Tom Gayner (Trades, Portfolio)’s Markel holds 173,000 shares at $14.2 million, with an average cost of $44.83, a gain of 78% from entry. Gayner’s framework at Markel is explicitly long duration and value-oriented; his continued hold at a price 78% above his average cost implies that his view of intrinsic value has risen alongside the business’s trajectory.
Ray Dalio (Trades, Portfolio)’s Bridgewater Associates added 31.76% to its position, bringing holdings to 346,000 shares valued at $28.4 million against an average buy price of $81.79. The addition is notable precisely because Bridgewater’s average cost is essentially at the current price; this is not a legacy position carried from a cheaper era but a deliberate recent accumulation at current levels. The Winton Group, David Harding’s systematic quantitative fund, initiated an entirely new position of 76,600 shares at an average of $83.44, a level near or above the current price. Systematic funds building new positions at current prices are expressing a model-derived view that the risk-adjusted return at this entry is favorable. Renaissance Technologies (Trades, Portfolio) added 2.66% to 397,000 shares at an average cost of $78.59, while Schonfeld trimmed 5.21%, an 8,100-share reduction that represents noise rather than conviction given the size of the remaining 147,000-share holding.
Long-duration value investors with entry prices well below today’s level have not exited despite substantial gains. Systematic and quantitative capital has been building exposure at or near current prices. The handful of holders with entries above today’s level, including Bridgewater and Winton, bought recently with full knowledge of the business’s current earnings trajectory and forward backlog. None of the largest holders signals a structural concern about the business; the pattern of retention and addition is consistent with a shared read that the forward earnings stream justifies a higher price than the market currently assigns.
Risks
The LSV Asset Management stake, which contributes approximately 15 to 20% of SEI’s pretax income, is a persistent source of earnings volatility that the rest of the business cannot fully offset in any single quarter. LSV operates a value-oriented active equity strategy, a style that has faced structural outflows as passive investing and factor-based strategies have displaced traditional active management mandates, particularly in the institutional channel. In Q4 2025, LSV experienced $3 billion of net outflows despite strong fund performance and $22 million in performance fees in the quarter. The long-term trajectory for traditional active equity, particularly global and international value, is unfavorable. If LSV’s AUM continues to contract over a multi-year period from the current level near $100 billion, the earnings contribution to SEI shrinks even if performance fees partially offset the flow pressure. LSV accounts for approximately $8 to $12 million of SEI’s earnings quarterly at normal performance fee levels, and that number is at structural risk regardless of how the rest of the business performs.
The Stratos acquisition introduces integration complexity and capital commitment risk that did not exist twelve months ago. At $440.8 million for the first close, with further roll-up acquisitions planned, SEI has committed a meaningful portion of its balance sheet cash to an advice aggregator business that is new to its operating model. The strategic rationale is sound, but execution risk is real: advice businesses are built on advisor relationships, and retention of those relationships through ownership transitions depends on cultural alignment, compensation structures, and operational continuity that can be difficult to maintain during integration. If Stratos becomes a distraction from the core platform business or fails to generate the revenue synergies management envisions, it will absorb capital that could otherwise have been returned to shareholders at prices that are, by management’s own behavior, attractive.
Market valuation sensitivity is the risk that is both obvious and unavoidable. Approximately 80% of SEI’s revenue is directly linked to the value of assets managed, administered, or under advisement. A sustained decline in global equity markets reduces that revenue base proportionally without a corresponding reduction in the platform’s fixed cost structure, compressing margins in the near term. SEI is better positioned than a pure asset manager in this scenario because the platform fees are stickier than performance fees and the outsourcing relationships tend to survive market dislocations, but the revenue is not immune to asset price declines. At a moment when tariff concerns, slowing global growth, and interest rate uncertainty have created genuine market volatility in early 2026, this risk is present rather than theoretical.
Conclusion
The Q1 2026 results, reported on April 22, answered every question the article originally posed. Net sales events reached $67.2 million, exceeding the prior quarterly record by more than 40%, and $57.1 million of that total was recurring. Private banking operating profit grew 40% year over year and margins expanded to 23%. Investment managers generated $50.5 million in net sales from enterprise-level mandates with alternative managers outsourcing for the first time. Adjusted EPS grew 21%. These are not forward estimates. They are reported results.
The market’s 14x multiple on this business reflects a period when SEI grew EPS at 2% per year and private banking was a drag on every other segment’s progress. That period produced a disappointing per-share record, and the multiple that resulted was not irrational. What has happened since is a genuine structural improvement: EPS compounding at 18 to 20% annually, a net sales backlog that has more than tripled, a segment turnaround visible in the margin data quarter after quarter, and a management team buying back 6% of the float annually at a price it has now held through for three consecutive years.
SEI’s 2026 annual meeting on May 27 and the accompanying investor presentation will offer the next window into whether this trajectory holds. The metrics that matter most are continued net sales momentum, particularly whether Q1’s $67.2 million pace is sustainable through the balance of the year, private banking margin progression toward the mid-20s, the rate at which the contract backlog converts to recognized revenue, and early evidence of how Stratos integrates into the broader advisor platform. The company has been clear about where it is headed. The shareholder meeting is where investors can measure whether the pace matches the ambition.
At $90 per share, the stock has moved off its lows and some of the easiest upside has been captured. What has not been captured is the earnings power that the record net sales backlog will produce over the next twelve to eighteen months as contracts convert to revenue. An owner at today’s price buys a debt-free platform processing $1.9 trillion in client assets at a forward multiple that still underprices the trajectory. The Q1 2026 data makes that trajectory unambiguous.
This content was originally published on Gurufocus.com

5 Stocks Our Experts Predict Could Double In the Next Year
By submitting your email, you'll also get a free pivot & flow membership. A free daily market overview. You can unsubscribe at any time.