The Market Movement
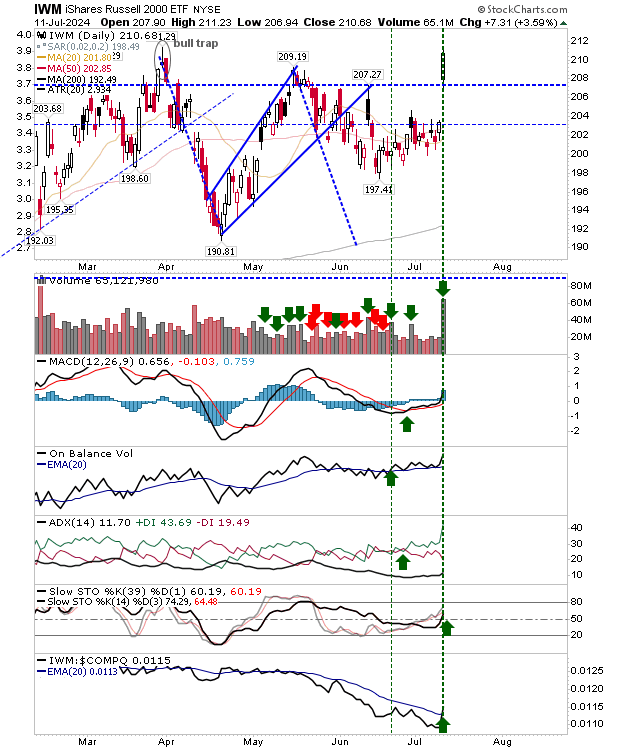
The Russell 2000 surged over 3%, overshadowing the hit taken by other market indices. This bullish movement, coupled with profit-taking, indicates a positive outlook for the broader market.
Technical Analysis
The Russell 2000 ($IWM) displayed strong momentum following a reaction to recent economic data. The surge in Small Caps was significant, with technical indicators showing a positive trend and a shift in favor towards Small Caps. The increased volume confirmed accumulation.
Market Charts
The S&P 500 experienced a loss after a previous gain, signaling distribution. While the loss occurred, significant damage will only happen upon a breakout support undercut at 5,500, potentially leading to a test of the 20-day Moving Average (MA).
The Nasdaq, having been over-extended by 20% from its 200-day MA, indicated a potential ‘strong’ sell signal due to its historic price extremes. Expected profit-taking might result in a correction, possibly reaching the 50-day MA.
Weekly Chart Analysis
The recent market action challenges the concept of a ‘bull trap’ in the Russell 2000 and suggests a potential topping in the Nasdaq and S&P 500. This scenario hints at a shift in trend or a temporary stall for the Nasdaq and S&P 500, while presenting positive opportunities for the Russell 2000.
5 Stocks Our Experts Predict Could Double In the Next Year
By submitting your email, you'll also get a free pivot & flow membership. A free daily market overview. You can unsubscribe at any time.