The Current State of the Market
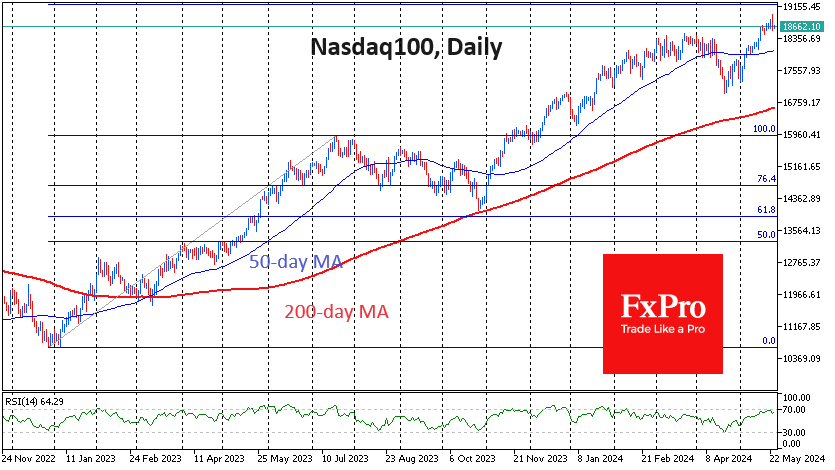
In May, the Nasdaq 100 emerged as a beacon of growth within US indices, exerting a positive influence on markets worldwide. By Thursday, the index was on the brink of hitting the 19,000 threshold, marking an impressive 11% surge from the lows recorded on April 19. The market witnessed a significant wave of selloffs, causing a 2% decline from its peak. The burning query lingers – are we on the cusp of a prolonged correction?
Technical Analysis
From a technical standpoint, the Nasdaq 100 index is straddling the edge of the overbought territory on RSI daily charts. Contrary to expectations, entering this zone often heralds intense growth, albeit cloaked in unpredictability. The current vigor from buyers stems from the index hovering just 1% above its prior peak. Post that peak, an April correction effectively deflated the market’s exuberance.
Historical Patterns and Future Projections
Reflecting on the correction observed between July and October last year reveals a classic Fibonacci pattern, nudging the Nasdaq 100 index close to 61.8% retracement of the initial rally and a whisker away from the 200-day moving average. Traditionally, this should pave the way for a surge to 161.8%, hovering around the 19,200 mark.
As the Nasdaq 100 inches towards a pivotal resistance threshold, a momentary pause to regroup seems plausible before embarking on a fresh ascension.
Outlook and Forecasts
Barring a seismic shift in sentiment or a sharp downturn in economic indicators, a steady decline in equity indices remains unlikely. The recent corrective phase, triggered by robust macroeconomic data, demonstrated the prospect of tighter monetary policies. Nonetheless, this isn’t sufficient cause to sound the alarm for a bear market in equities.
Yet, vigilance is warranted as a breach below the earlier consolidation ceiling around 18,300 could serve as a crucial technical indicator of an impending trend reversal.