MicroStrategy IncMSTR has upped the ante on its bold gamble with BitcoinBTC/USD, recently acquiring a staggering $1.11 billion worth of the cryptocurrency between August and September.
This latest move catapults the company’s Bitcoin stash to an astonishing 244,800 coins, now standing tall at around $9.45 billion.
As MicroStrategy continues to intertwine its fate with the capricious realm of Bitcoin, investors are grappling with a pressing question: Can the stock sustain its upward trajectory, or is a market correction on the horizon?
MicroStrategy CEO Michael Saylor‘s unwavering allegiance to Bitcoin has propelled the stock skyward by 96% since the beginning of the year and an astounding 295% over the past 12 months. Eager to fuel further Bitcoin acquisitions, the company is in the process of amassing an extra $700 million through convertible bonds, demonstrating its unwavering dedication to the cause.
However, while the long-term game plan might yield dividends, the immediate technical outlook casts a shadow of doubt.
Read Also: MicroStrategy Is ‘Aggressive’ With ‘BTC HODL’, Analyst Says, Citing New Bitcoin Buys
Mixed Technical Signals: Striving Higher or Awaiting a Retreat?
Despite the bullish sentiment surrounding MicroStrategy’s Bitcoin ventures, a more guarded perspective emerges from the technical analysis.

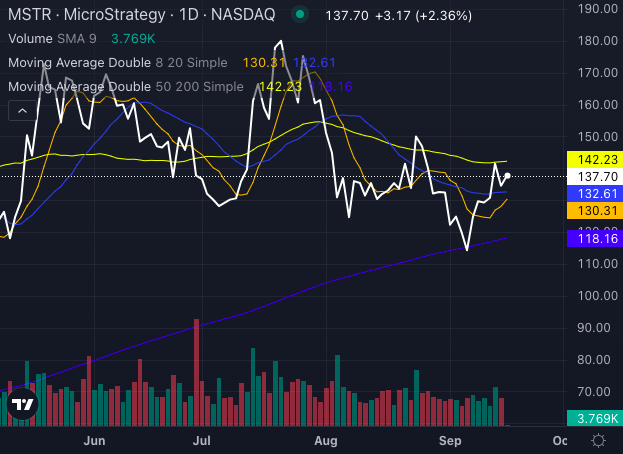
Chart created using Benzinga Pro
- Eight-day and 20-day SMA: MicroStrategy stock is trading above its eight-day and 20-day simple moving averages (SMA) of $130.31 and $132.61, respectively, hinting at short-term bullish trends.
- 50-day SMA: Nonetheless, the stock remains below its 50-day SMA of $142.23, indicating possible intermediate-term weakness and advising caution for traders.
- 200-day SMA: In the long run, MicroStrategy’s stock stands firm above its 200-day SMA of $118.16, maintaining an optimistic outlook for the extended future.

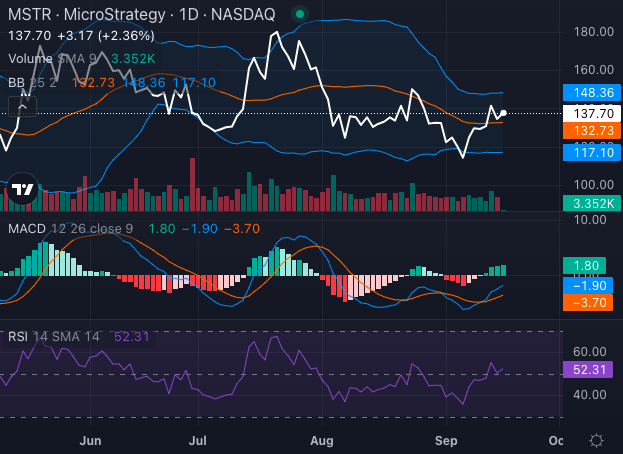
Chart created using Benzinga Pro
- MACD: The Moving Average Convergence Divergence (MACD) currently stands at a negative 1.90, indicating bearish momentum, suggesting a potential loss of steam.
- RSI: With a neutral Relative Strength Index (RSI) reading of 52.31, MicroStrategy stock sits in a limbo between overbought and oversold territories, signaling a crucial tipping point.
These conflicting signals point towards a potential phase of consolidation for the stock. Investors are advised to exercise caution, as momentum indicators hint at the possibility of a retreat.
Risk and Reward in the Balance
MicroStrategy initially dipped its toes in Bitcoin waters back in 2020, framing the digital currency as a shield against inflation. Fast forward to 2024, and Saylor’s unswerving focus on Bitcoin has firmly positioned MicroStrategy as a stand-in for the cryptocurrency.
Regulatory ambiguities and Bitcoin’s inherent volatility stand out as the primary hazards to MicroStrategy’s future performance.
However, with Bitcoin ETFs propelling the asset class into the mainstream, the company could find itself in a prime position to capitalize on broader adoption. Yet, technical indicators hint that the stock might need to regroup before marching onwards.
MicroStrategy’s relentless Bitcoin shopping spree has thrust the company into the epicenter of the crypto market’s expansion. While the company’s enduringly bullish stance on Bitcoin remains steadfast, immediate technical cues suggest a possible lull in MicroStrategy’s stock surge.
Read Next:
Image: Shutterstock


