Microsoft MSFT reported first-quarter fiscal 2026 earnings of $4.13 per share, which beat the Zacks Consensus Estimate by 13.15% and increased 25.2% on a year-over-year basis.
Revenues of $77.6 billion increased 18.4% year over year and beat the Zacks Consensus Estimate by 3.62%. At constant currency (cc), revenues grew 17% year over year, showcasing strong demand for cloud and AI offerings.
Commercial bookings increased 112% and (up 111% in cc) and were significantly ahead of expectations, driven by Azure commitments from OpenAI, as well as continued growth in the number of 100-million-dollar-plus contracts for both Azure and M365. These results do not include any impact from the incremental $250 billion Azure commitments from OpenAI announced yesterday.
Commercial remaining performance obligation increased to $392 billion and was up 51% year over year. The balance has nearly doubled over the past two years.
Microsoft Cloud revenues were $49.1 billion, ahead of expectations, and grew 26% (up 25% in cc). Microsoft Cloud’s gross margin percentage was slightly better than expected at 68%, and down year over year due to the investments in AI that were partially offset by ongoing efficiency gains as noted earlier.
Microsoft’s shares, which have soared by 25.7% so far this year, edged down by 3.7% in extended trading on Thursday after finance chief Amy Hood announced that total capital expenditure spend will increase sequentially, and the fiscal year 2026 growth rate is now expected to be higher than fiscal 2025, reversing prior guidance that anticipated a slowdown in spending growth. This acceleration is driven by growing demand for cloud and AI capacity, with Microsoft pivoting increasingly toward short-lived assets, primarily GPUs and CPUs, to match contract durations and usage expectations. The company noted that there can be quarterly spend variability from cloud infrastructure buildouts and the timing of delivery of finance leases.
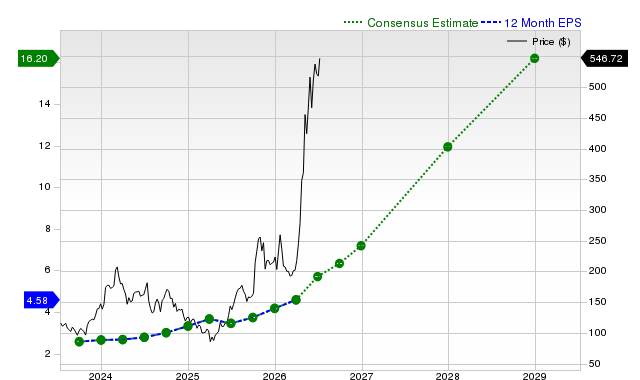
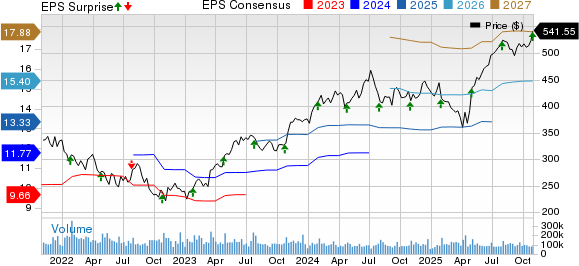
Microsoft Corporation Price, Consensus and EPS Surprise

Microsoft Corporation price-consensus-eps-surprise-chart | Microsoft Corporation Quote
Segmental Details
The Productivity & Business Processes segment, which includes the Office and Dynamics CRM businesses, contributed 42.5% to total revenues. Revenues increased 17% (up 14% at cc) on a year-over-year basis to $33.02 billion, driven by M365 commercial products and cloud services and M365 consumer products and cloud services.
M365 commercial cloud revenues increased 17% (up 15% in cc), with 1 point of benefit from in-period revenue recognition. Year-over-year growth was driven by both ARPU and seats, with ARPU growth again led by E5 and M365 Copilot.
Paid M365 commercial seats grew 6% year over year with installed base expansion across all customer segments, though primarily in the company’s small and medium business and frontline worker offerings.
M365 commercial products revenues increased 17% (up 14% in cc), ahead of expectations due to higher-than-expected Office 2024 transactional purchasing.
M365 consumer cloud revenue increased 26% (up 25% in cc), driven by ARPU growth. M365 consumer subscriptions grew 7% to over 90 million.
LinkedIn revenues increased 10% (up 9% in cc), driven by Marketing Solutions. The Talent Solutions business was impacted by continued weakness in the hiring market.
Dynamics 365 revenues jumped 18% (up 16% in cc), with continued growth across all workloads.
Segment gross margin dollars increased 19% (up 16% in cc), and gross margin percentage increased, driven by efficiency gains in M365 Commercial cloud that were partially offset by investments in AI, including the impact of growing usage in M365 Copilot Chat. Operating expenses rose 6% (up 5% in cc) and operating income grew 24% (up 20% in cc). Operating margins increased 3 points year over year to 62%, driven by the higher gross margin as well as improved operating leverage.
The Intelligent Cloud segment, including server and enterprise products and services, contributed 39.8% to total revenues. The segment reported revenues of $30.89 billion and grew 28% (up 27% in cc), driven by Azure and the on-premises server business.
In Azure and other cloud services, revenues grew 40% (up 39% in cc), significantly ahead of expectations, driven by accelerated growth in core infrastructure business primarily from the company’s largest customers. Revenues from Azure AI services were generally in line with expectations.
In the on-premises server business, revenues increased 1% (relatively unchanged in cc), ahead of expectations, primarily driven by transactional purchasing of Windows Server 2025.
Segment gross margin dollars increased 20% (up 19% in cc), while gross margin percentage decreased year over year due to investments in AI that were partially offset by efficiency gains in Azure. Operating expenses increased 4% and operating income grew 27%. Operating margins were 43%, down only slightly year-over-year, as increased investments in AI were mostly offset by improved operating leverage.
More Personal Computing segment, which primarily comprises Windows, Gaming, Devices and Search businesses, contributed 17.7% to total revenues. Revenues were $13.75 billion, up 4% year-over-year, primarily driven by strength in Windows OEM.
Windows OEM and Devices revenues increased 6% year-over-year, significantly ahead of expectations, driven by strong demand ahead of Windows 10 end of support, as well as a benefit from inventory levels that remained elevated.
Search and news advertising revenues ex-TAC increased 16% (up 15% in cc), driven by growth in volume, as well as a continued benefit from third-party partnerships that was better-than-expected.
In Gaming, revenues decreased 2% (down 3% in cc). Against a strong prior year comparable Xbox content and services, revenues rose 1% (relatively unchanged in cc), driven by better-than-expected performance from third-party content.
The company reported 500 million monthly active users across gaming platforms and devices. Microsoft became the top publisher on both Xbox and PlayStation in the reported quarter, with the successful launches of Forza Horizon 5 and Oblivion Remastered.
Segment gross margin dollars increased 11% (up 10% in cc). Gross margin percentage increased year over year, driven by sales mix shift to higher margin businesses.
Operating expenses increased 4% (up 3% in cc). Operating income rose 18% (up 16% in cc). Operating margins increased 3 points year over year to 30% driven by the higher gross margin.
Azure Infrastructure and Capacity Expansion
Microsoft announced plans to increase total AI capacity by more than 80% this year and roughly double the total data center footprint over the next two years. The company unveiled Fairwater in Wisconsin as the world’s most powerful AI data center, which will scale to two gigawatts and go online next year. Microsoft deployed the world’s first large-scale cluster of NVIDIA GB300s and is building a fungible fleet that spans all stages of the AI lifecycle, from pre-training to post-training, synthetic data generation, and inference. However, the company expects to remain capacity-constrained through at least the end of fiscal year 2026, with demand exceeding current infrastructure build-out, resulting in lost revenue opportunities for Azure.
AI Platform and Azure AI Foundry
Azure AI Foundry now serves 80,000 customers, including 80% of the Fortune 500, with access to over 11,000 models from various providers. The platform added OpenAI’s GPT-5 and xAI’s GRAQ-4 during the quarter. Microsoft’s first-party MAI models for text, voice, and image generation debuted among the top in industry leaderboards, while the Phi family of small language models has been downloaded over 60 million times, up three times year over year. The company introduced the Microsoft Agent Framework to help developers orchestrate multi-agent systems with compliance, observability, and deep integration capabilities.
Data and Analytics Products
Microsoft Fabric revenue grew 60%, faster than any other data and analytics platform in the industry, with 28,000 paid Fabric customers. In databases, SQL DB hyperscale revenue increased nearly 75%, and Cosmos DB grew 50%. These data products are increasingly integrated with AI capabilities, enabling customers to build comprehensive analytics solutions on Azure’s infrastructure.
Microsoft 365 and Copilot Momentum
Microsoft now has 900 million monthly active users of AI features across its products, with over 150 million monthly active users of first-party Copilots. More than 90% of the Fortune 500 now use Microsoft 365 Copilot, with major customers deploying tens of thousands of seats. The company introduced agent mode for Microsoft 365 Copilot, which transforms single prompts into expert-quality documents, spreadsheets and presentations, and Teams mode for collaborative AI experiences. Adobe ADBE, Asana, Jira, LexisNexis, SAP, ServiceNow NOW, Snowflake SNOW, and Workday, among others, are building their own agents that connect to Copilot.
Operating Results of MSFT
Gross profit increased 17.9% year over year to $53.6 billion. The gross margin contracted 30 basis points to 69% driven by investments in AI, including the impact of scaling AI infrastructure and the growing usage of AI product features. This was partially offset by ongoing efficiency gains, particularly in Azure and M365 Commercial cloud.
Operating expenses increased 5% (up 4% in cc), driven by investments in cloud and AI engineering, including compute capacity and AI talent to support product development across the portfolio. Operating margins increased year-over-year to 49% and were ahead of expectations with stronger-than-anticipated results in high-margin businesses.
Productivity & Business Process operating income rose 23.6% to $20.4 billion. Intelligent Cloud operating income increased 27.5% to $13.3 billion. More Personal Computing’s operating income increased 17.8% to $4.16 billion
Capital expenditures totaled $34.9 billion in the fiscal first quarter, with roughly half allocated to short-lived assets, primarily GPUs and CPUs, to support increasing Azure platform demand and first-party applications. The remaining spend focused on long-lived assets supporting monetization for the next fifteen years and beyond, including $11.1 billion in finance leases primarily for large data center sites.
Balance Sheet & Cash Flow
As of Sept. 30, 2025, Microsoft had a total cash, cash equivalents and short-term investments balance of $102.01 billion compared with $94.56 billion as of June 30, 2025.
As of Sept. 30, 2025, long-term debt (including the current portion) was $43.2 billion compared with $43.15 billion as of June 30, 2025.
Cash flow from operations was $45.1 billion, up 32% driven by strong cloud billings and collections, partially offset by higher supplier payments. Free cash flow increased 33% to $25.7 billion, with minimal impact from the sequential increase in capex given the higher mix of finance leases.
Microsoft returned $10.7 billion to shareholders through dividends and share repurchases.
OpenAI Partnership and Future Outlook
Microsoft closed a new definitive agreement with OpenAI, securing exclusive rights for Azure until AGI achievement or through 2030, and extended model and product IP rights through 2032. OpenAI has contracted an incremental $250 billion of Azure services, not reflected in the fiscal first-quarter results, representing a substantial future revenue opportunity.
For the second quarter of fiscal 2026, Microsoft expects total company revenues between $79.5 billion and $80.6 billion, representing growth of 14% to 16%. It anticipates cost of goods sold between $26.35 billion and $26.55 billion, with growth of 21% to 22%, and operating expenses ranging from $17.3 billion to $17.4 billion, with growth of 7% to 8%. Operating margins are expected to be relatively flat year over year and down sequentially, aligned with historic seasonality, while the effective tax rate should be approximately 19%.
In commercial bookings for the fiscal second quarter, Microsoft expects healthy growth in the core business on a low-expiry base when adjusted for the OpenAI contracts in the prior year. Commercial bookings will be positively impacted by the significant OpenAI commitments announced, with larger long-term Azure contracts driving increased quarterly volatility in bookings growth rates due to their unpredictable timing.
This Zacks Rank #2 (Buy) company expects Productivity and Business Processes revenues between $33.3 billion and $33.6 billion, representing growth of 13% to 14%. You can see the complete list of today’s Zacks #1 Rank (Strong Buy) stocks here.
Within this segment, Microsoft 365 commercial cloud revenue growth is expected to be between 13% and 14% in cc, with business trends remaining relatively stable quarter over quarter, and ARPU growth again driven by E5 and Microsoft 365 Copilot. Microsoft 365 commercial products revenue growth is expected in the low to mid-single digits, though components can be variable due to end-period revenue recognition dynamics. Microsoft 365 consumer cloud revenue growth is expected in the mid-20s percent, driven by growth in ARPU. LinkedIn revenue is expected to grow approximately 10%. Dynamics 365 revenue growth is expected in the mid to high teens, with continued growth across all workloads.
For the Intelligent Cloud segment, Microsoft expects revenues between $32.25 billion and $32.55 billion, representing growth of 26% to 27%. For the fiscal second quarter, Microsoft expects Azure and other cloud services revenue growth of approximately 37% in cc, as demand remains significantly ahead of available capacity. The company now expects to be capacity-constrained through at least the end of the fiscal year, with demand exceeding current infrastructure buildout and resulting in lost revenue opportunities for Azure. Microsoft will continue to balance Azure revenue growth with growing needs across first-party applications and AI solutions, R&D efforts, and end-of-life server replacements.
For the on-premises server business, Microsoft expects revenue to decline in the low to mid-single digits with ongoing customer shift to cloud offerings. Microsoft Cloud gross margin percentage is expected to be roughly 66%, down year over year, due to continued investments in AI as well as the mix shift to Azure.
Microsoft expects More Personal Computing revenues in the range of $13.95 billion to $14.45 billion. Windows OEM revenue is expected to decline low to mid-single digits, despite continued momentum from Windows 10 end of support, as growth rates will be impacted by elevated inventory levels at OEMs that are expected to come down through the quarter.
Search and news advertising revenues, excluding traffic acquisition costs growth, is expected to be in the low double digits percentage, down sequentially as growth rates normalize following the benefit from third-party partnerships, with continued growth driven by volume and revenue per search across Edge and Bing. In gaming, Xbox content and services revenues are expected to decline in the low to mid-single digits against a prior year comparable that benefited from strong first-party performance, partially offset by growth in subscriptions, while hardware revenue should decline year over year.
Zacks’ Research Chief Picks Stock Most Likely to “At Least Double”
Our experts have revealed their Top 5 recommendations with money-doubling potential – and Director of Research Sheraz Mian believes one is superior to the others. Of course, all our picks aren’t winners but this one could far surpass earlier recommendations like Hims & Hers Health, which shot up +209%.
See Our Top Stock to Double (Plus 4 Runners Up) >>
Microsoft Corporation (MSFT) : Free Stock Analysis Report
Adobe Inc. (ADBE) : Free Stock Analysis Report
ServiceNow, Inc. (NOW) : Free Stock Analysis Report
Snowflake Inc. (SNOW) : Free Stock Analysis Report
This article originally published on Zacks Investment Research (zacks.com).
5 Stocks Our Experts Predict Could Double In the Next Year
By submitting your email, you'll also get a free pivot & flow membership. A free daily market overview. You can unsubscribe at any time.