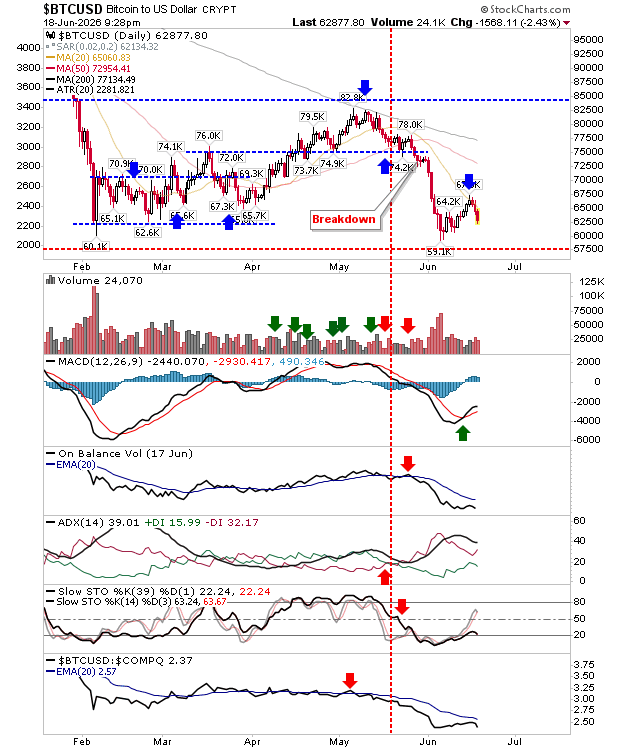
continues to play dead as indices hold their ground. The 20-day MA of Bitcoin is resistance as today’s selling places it on course to test 60K (again), although I suspect the next test will fail, it’s too recent a test since the February low test bounce. Only the MACD is offering a weak ’buy’.

The played true to its tweezer top as yesterday’s loss took the index back to its 20-day MA. There is a weak MACD ’sell’, but other technicals are bullish. An undercut of the 20-day MA would set up for a test of the 50-day MA.

The posted big volume, but little change on the day. It might be a swing trade to some; a move above the day’s highs would open up a test for the all-time high.
The () offers the most bullish setup, with today’s candlestick marking buying pressure on net bullish technicals.

On the other side. The closed with two bearish spike highs that present a shorting opportunity.

While the Semiconductor Index accelerates again. It now trades 72%(!) above its 200-day MA. This is simply unsustainable, so watch for the ’bear trap’.
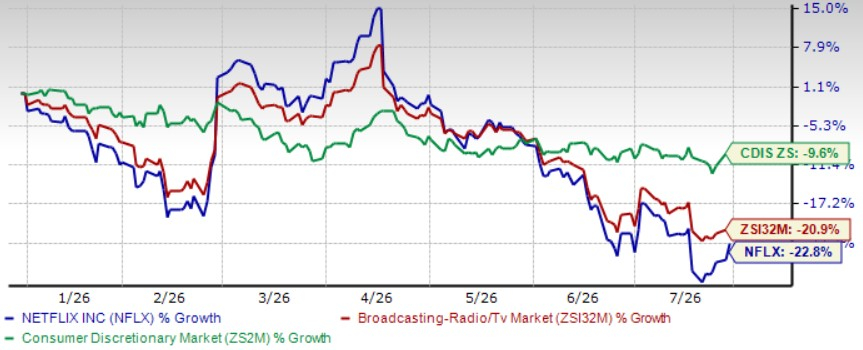
There are too many big divergences taking place with Semiconductors blasting higher and Bitcoin fading lower. Other indices are caught in the middle, but playing the movers-and-shakers gives near-term traders the opportunity for profits, but there is little here for long-term investors.
5 Stocks Our Experts Predict Could Double In the Next Year
By submitting your email, you'll also get a free pivot & flow membership. A free daily market overview. You can unsubscribe at any time.