Walt Disney (NYSE:DIS) is set to report its Q3 FY’25 results around Wednesday, August 6, 2025. Earnings are expected to come in at about $1.44 per share, per consensus estimates, while revenue is projected to grow by about 2.5% to $23.75 billion. Disney+ and the company’s broader streaming portfolio are expected to remain key financial drivers this quarter. While subscriber growth may be muted due to recent price hikes, Disney has been focusing on improving the profitability of its direct-to-consumer (DTC) operations. In Q2 FY’25, Disney’s DTC segment generated operating income of $336 million, up from just $47 million a year earlier, driven by price hikes and higher advertising revenues.
The company has also been cracking down on password sharing, aiming to convert shared users into paying customers by introducing an extra-member fee starting at $7 per month. Disney’s experiences segment has also been faring well of late, led by strong attendance at its U.S. parks and also due to rising capacity in the cruising segment, which saw the Disney Treasure cruise ship enter service late last year.
The company has $218 billion in current market capitalization. Revenue over the last twelve months was $94 billion, and it was operationally profitable, with $14 billion in operating profits and net income of $8.9 billion. While a lot will depend on how results stack up against consensus and expectations, understanding historical patterns might just turn the odds in your favor if you are an event-driven trader.
There are two ways to do that: understand the historical odds and position yourself prior to the earnings release, or look at the correlation between immediate and medium-term returns post earnings and position yourself accordingly after the earnings are released. That said, if you seek upside with lower volatility than individual stocks, the Trefis High Quality portfolio presents an alternative – having outperformed the S&P 500 and generated returns exceeding 91% since its inception.
See earnings reaction history of all stocks
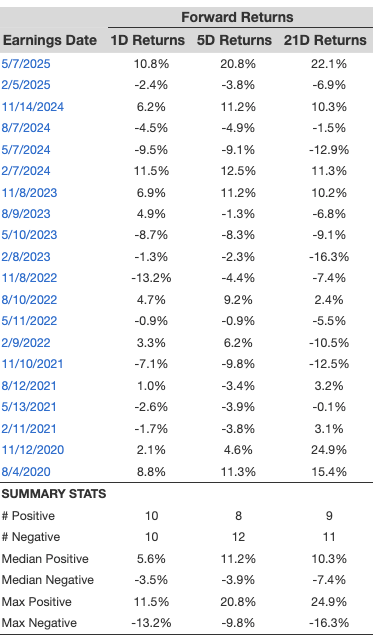
Walt Disney’s Historical Odds Of Positive Post-Earnings Return
Some observations on one-day (1D) post-earnings returns:
- There are 20 earnings data points recorded over the last five years, with 10 positive and 10 negative one-day (1D) returns observed. In summary, positive 1D returns were seen about 50% of the time.
- The percentage remains the same at 50% if we consider data for the last 3 years instead of 5.
- Median of the 10 positive returns = 5.6%, and median of the 10 negative returns = -3.5%
Additional data for observed 5-Day (5D), and 21-Day (21D) returns post earnings are summarized along with the statistics in the table below.
Correlation Between 1D, 5D, and 21D Historical Returns
A relatively less risky strategy (though not useful if the correlation is low) is to understand the correlation between short-term and medium-term returns post earnings, find a pair that has the highest correlation, and execute the appropriate trade. For example, if 1D and 5D show the highest correlation, a trader can position themselves “long” for the next 5 days if 1D post-earnings return is positive. Here is some correlation data based on 5-year and 3-year (more recent) history. Note that the correlation 1D_5D refers to the correlation between 1D post-earnings returns and subsequent 5D returns.

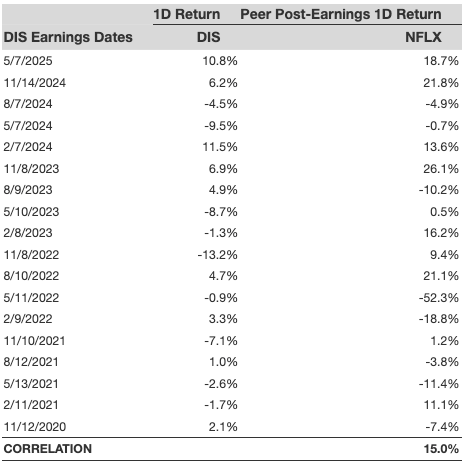
Is There Any Correlation With Peer Earnings?
Sometimes, peer performance can have influence on post-earnings stock reaction. In fact, the pricing-in might begin before the earnings are announced. Here is some historical data on the past post-earnings performance of Walt Disney stock compared with the stock performance of peers that reported earnings just before Walt Disney. For fair comparison, peer stock returns also represent post-earnings one-day (1D) returns.
Learn more about Trefis RV strategy that has outperformed its all-cap stocks benchmark (combination of all 3, the S&P 500, S&P mid-cap, and Russell 2000), to produce strong returns for investors. Separately, if you want upside with a smoother ride than an individual stock like Walt Disney, consider the High Quality portfolio, which has outperformed the S&P, and clocked >91% returns since inception.
Invest with Trefis Market-Beating Portfolios
See all Trefis Price Estimates
5 Stocks Our Experts Predict Could Double In the Next Year
By submitting your email, you'll also get a free pivot & flow membership. A free daily market overview. You can unsubscribe at any time.