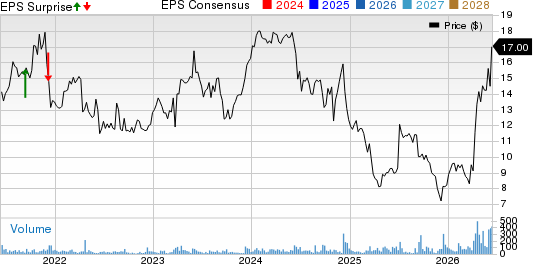
Paramount Global (NASDAQ:PARA) is set to report its earnings around May 8, 2025. Revenues are likely to decline by about 7% year-over-year to $7.13 billion, per consensus estimates, while earnings are estimated to come in at about $0.26 per share, down from $0.62 per share in the year-ago period. We expect the company’s traditional TV business to continue to face headwinds over the quarter due to lower spending by advertisers and a broader shift away from linear TV. However, we expect the direct-to-consumer business to fare better, led by rising subscriber numbers. Advertising for the DTC business could also pick up year-over-year, driven by higher engagement on the Paramount+ and Pluto TV platforms.
Paramount has $7.8 billion in current market capitalization. Revenue over the last twelve months stood at about $27.2 billion, while net losses stood at about $6 billion. That said, if you seek upside with lower volatility than individual stocks, the Trefis High Quality portfolio presents an alternative, having outperformed the S&P 500 and generated returns exceeding 91% since its inception.
See earnings reaction history of all stocks
Paramount Global’s Historical Odds Of Positive Post-Earnings Return
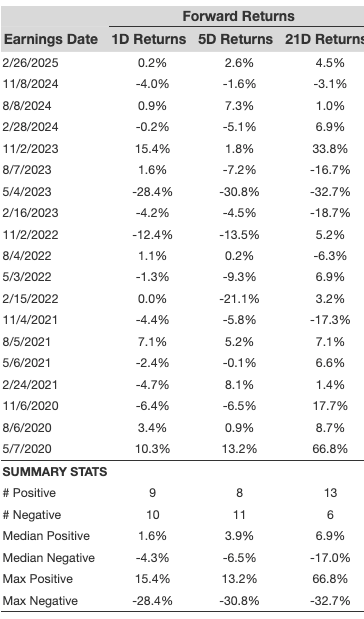
Some observations on one-day (1D) post-earnings returns:
- There are 19 earnings data points recorded over the last five years, with 9 positive and 10 negative one-day (1D) returns observed. In summary, positive 1D returns were seen about 47% of the time.
- However, this percentage decreases to 45% if we consider data for the last 3 years instead of 5.
- Median of the 9 positive returns = 1.6%, and median of the 10 negative returns = -4.3%
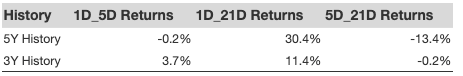
Additional data for observed 5-Day (5D), and 21-Day (21D) returns post earnings are summarized along with the statistics in the table below.
Correlation Between 1D, 5D, and 21D Historical Returns
A relatively less risky strategy (though not useful if the correlation is low) is to understand the correlation between short-term and medium-term returns post earnings, find a pair that has the highest correlation, and execute the appropriate trade. For example, if 1D and 5D show the highest correlation, a trader can position themselves “long” for the next 5 days if 1D post-earnings return is positive. Here is some correlation data based on 5-year and 3-year (more recent) history. Note that the correlation 1D_5D refers to the correlation between 1D post-earnings returns and subsequent 5D returns.
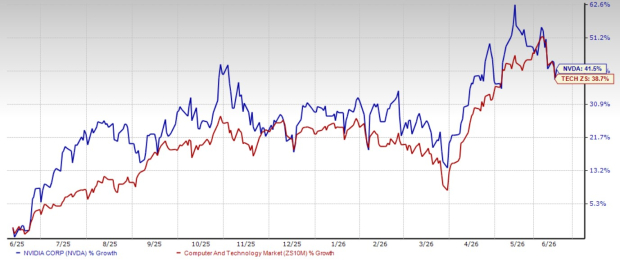
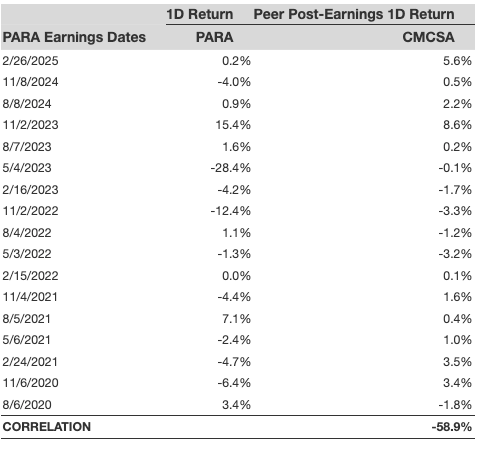
Is There Any Correlation With Peer Earnings?
Sometimes, peer performance can have influence on post-earnings stock reaction. In fact, the pricing-in might begin before the earnings are announced. Here is some historical data on the past post-earnings performance of Paramount Global stock compared with the stock performance of peers that reported earnings just before Paramount Global. For fair comparison, peer stock returns also represent post-earnings one-day (1D) returns.
Learn more about Trefis RV strategy that has outperformed its all-cap stocks benchmark (combination of all 3, the S&P 500, S&P mid-cap, and Russell 2000), to produce strong returns for investors. Separately, if you want upside with a smoother ride than an individual stock like Paramount Global, consider the High Quality portfolio, which has outperformed the S&P, and clocked >91% returns since inception.
5 Stocks Our Experts Predict Could Double In the Next Year
By submitting your email, you'll also get a free pivot & flow membership. A free daily market overview. You can unsubscribe at any time.