Deep-pocketed investors have embraced a bullish stance towards Amazon.com AMZN, signifying a seismic shift in market dynamics. Ignoring the surge of optimism among these market whales would be akin to sailing past a pot of gold unnoticed. Today, Benzinga’s options scanner unveiled 48 exceptional options activities surrounding Amazon.com, a deviation from the norm that demands attention.
The sentiment within this enclave of heavyweight investors is a split verdict, with 58% facing north in bullish territory and 29% bearing a bearish outlook. Noteworthy mentions include 5 puts valued at $235,930 and a staggering 43 calls summing up to $3,342,988.
Predicted Price Range
Considering the Volume and Open Interest figures on these contracts, it appears that the whales have circled a price range from $50.0 to $225.0 for Amazon.com over the past 3 months.
Interpreting Volume & Open Interest
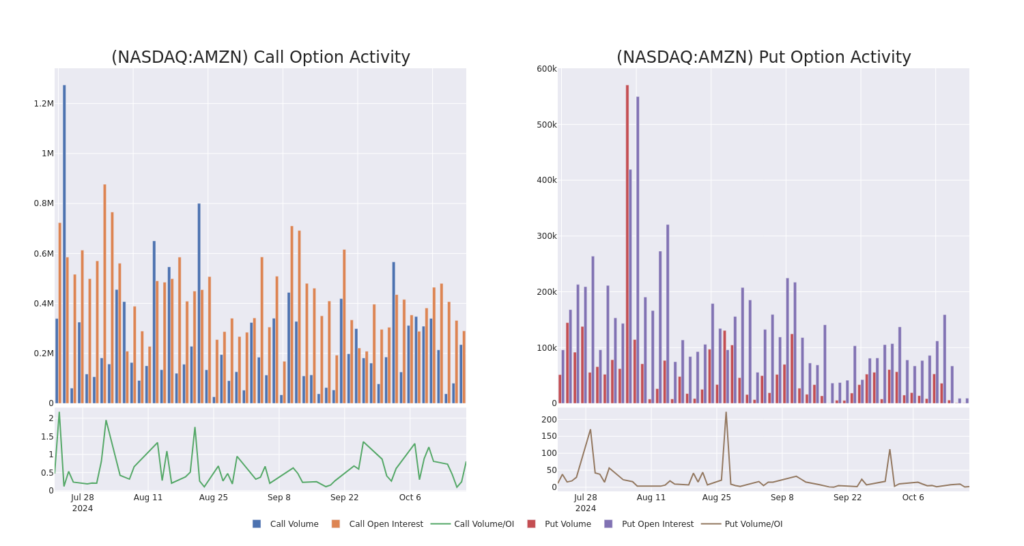
Delving into the realms of volume and open interest stands as a prudent maneuver when navigating the complex web of options trading. Monitoring the liquidity and interest levels for Amazon.com’s options centered around different strike prices provides valuable insights. An examination of the evolution of call and put options’ volume and open interest within the $50.0 to $225.0 strike price spectrum paints a revealing picture over the last 30 days.
Amazon.com Call and Put Volume: 30-Day Overview

Standout Options Detected:
| Symbol | PUT/CALL | Trade Type | Sentiment | Exp. Date | Ask | Bid | Price | Strike Price | Total Trade Price | Open Interest | Volume |
|---|---|---|---|---|---|---|---|---|---|---|---|
| AMZN | CALL | SWEEP | BULLISH | 03/21/25 | $6.0 | $5.9 | $6.0 | $220.00 | $385.7K | 4.5K | 3.8K |
| AMZN | CALL | SWEEP | BULLISH | 03/21/25 | $5.9 | $5.8 | $5.9 | $220.00 | $361.6K | 4.5K | 1.8K |
| AMZN | CALL | SWEEP | BULLISH | 03/21/25 | $6.0 | $5.9 | $6.0 | $220.00 | $356.5K | 4.5K | 2.7K |
| AMZN | CALL | SWEEP | BULLISH | 03/21/25 | $5.95 | $5.9 | $5.95 | $220.00 | $286.1K | 4.5K | 4.6K |
| AMZN | CALL | SWEEP | BULLISH | 04/17/25 | $5.4 | $5.3 | $5.4 | $225.00 | $135.0K | 987 | 1.7K |
About Amazon.com
Amazon reigns supreme as the foremost online retailer and a bustling marketplace for third-party sellers. Retail-related revenue commands approximately 75% of the total income, with Amazon Web Services boasting a 15% share, followed by advertising services controlling 5% to 10%. The international landscape constitutes a significant part of Amazon’s non-AWS sales, spearheaded by vibrant markets like Germany, the United Kingdom, and Japan.
In light of the recent flurry of options activity encircling Amazon.com, the time is ripe to shift focus onto the company itself. Let’s peel back the layers to uncover its current performance metrics.
Amazon.com Current Status
- Trading volume stands tall at 18,285,398, with AMZN’s price scaling up by 1.65%, perched at $190.62.
- RSI indicators hint at the stock treading into potentially overbought realms.
- An earnings bombshell is anticipated in a mere 13 days.
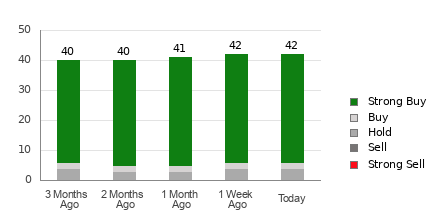
Analyst Insights on Amazon.com
A squadron of 5 seasoned analysts has recently voiced their opinions on this stock, collectively projecting an average price target of $248.0.
Options are the wild stallions of the trading world, offering untapped potential amidst a realm of volatility. Seasoned traders adeptly navigate these waters by arming themselves with knowledge, deploying strategic entry and exit tactics, leaning on multiple indicators, and devouring market movements with eagle-eyed precision. Should you seek a ringside view of the latest Amazon.com options trades, look no further than Benzinga Pro for real-time alerts.