As investors navigate the tumultuous waters of the market, it’s imperative to tread with caution, steering clear of relying solely on age-old adages. Keeping a balanced sentiment in trading is crucial to avoid veering into the extremes of market emotions.
Amidst the prevailing uncertainties, a glimmer of hope shines through as certain sectors demonstrate resilience in the face of September skepticism propagated by the media, offering a different perspective than the prevailing pessimism.
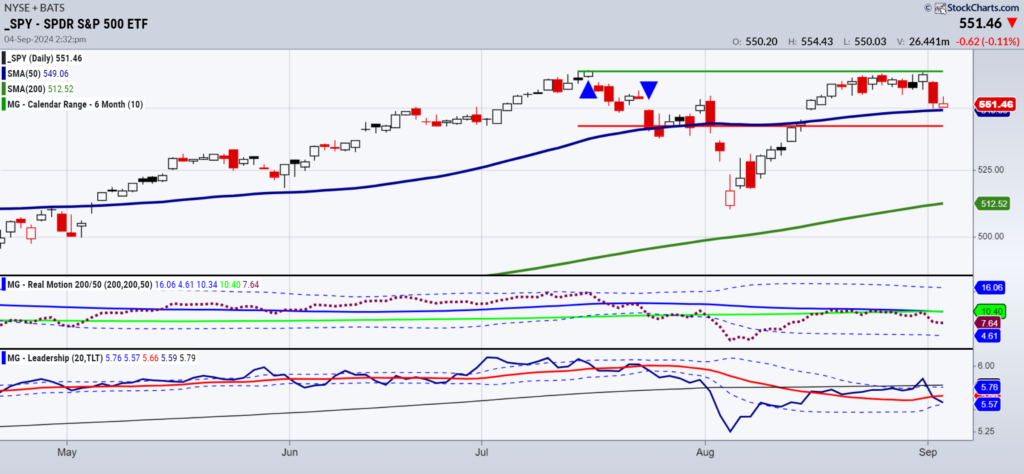
SPY Looking at Key Moving Averages
Examining the market indicators, the SPY finds itself perched on its 50-day moving average, serving as a crucial pivot point. While bearish momentum persists, a Real Motion analysis positions today’s movement as a period of consolidation. The market’s performance hinges on the SPY’s ability to hold ground above this key average.
A notable shift in leadership against long bonds towards SPY signifies a shift towards a risk-on sentiment. In a bullish market scenario, the outperformance of SPY against TLT is a favorable indicator, suggesting a positive market outlook.
IYT’s Candlestick Patterns Unveil Clues
IYT, a significant player in the market, showcases an intriguing candle pattern, an inverted hammer doji. This pattern, with its close opening and closing prices and a downward hammer, alludes to potential forced selling. The fate of IYT holds pivotal importance for the market’s trajectory in the upcoming days, with a decisive breakthrough at 67.50 indicating positive prospects.
Furthermore, should IYT’s momentum wane, failing to maintain its dominance over SPY, a sense of caution needs to prevail among investors, with considerations for safer positions like TLT.
Tracing the trajectory of MP Materials, their recent surge of around 8% following the announcement of a substantial buyback program highlights the impact of strategic decisions on market momentum.
Key Insights from the ETF Market
(Pivotal levels denote short-term bullish or bearish trends)
- S&P 500 (SPY): 549 marks the 50-DMA
- Russell 2000 (IWM): 212 signifies the 50-DMA
- Dow (DIA): 410 remains pivotal
- Nasdaq (QQQ): Indicates a warning phase with 455 serving as a support
- Regional banks (KRE): The figure at 57 holds significance
- Semiconductors (SMH): Find support at 217, the 200-DMA
- Transportation (IYT): Essential to maintain levels above 65
- Biotechnology (IBB): New range defined between 145-150
- Retail (XRT): Confirmation with 73.50 as the critical 200-DMA level
- iShares iBoxx Hi Yd Cor Bond ETF (HYG): Indicates a predilection towards high-yield bonds among traders


