Earnings season is akin to a high-stakes theater act unfolding this week, starring an ensemble cast of illustrious entities. Among the marquee players eagerly awaited to grace the stage are Taiwan Semiconductor (TSM), Bank of America (BAC), United Airlines (UAL), Netflix (NFLX), Goldman Sachs (GS), Johnson & Johnson (JNJ), and Morgan Stanley (MS).
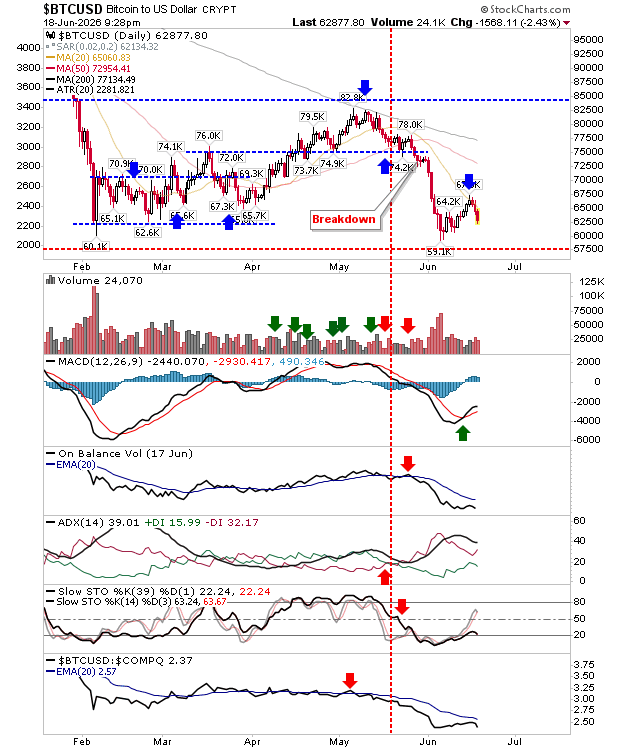
Prior to an earnings report, a cloak of uncertainty descends over the market, driving up implied volatility as speculators and hedgers jostle for options. This heightened demand inflates option prices until the fateful revelation. Post-earnings, like the morning mist dissolving in the sun, implied volatility tends to recede back to its tranquil levels.
Let us gaze into the crystal ball of estimated stock movements. By summing up the at-the-money put and call options post-earnings, we derive an expected range – an imperfect but telling approximation.
Monday
GS – 3.8%
BLK – 3.3%
Tuesday
UNH – 4.7%
BAC – 3.9%
MS – 3.8%
SCHW – 5.1%
PNC – 4.4%
Wednesday
AMSL – 6.8%
JNJ – 2.7%
USB – 4.3%
KMI – 2.2%
LVS – 2.9%
UAL – 8.7%
Thursday
TSM – 7.5%
NFLX – 8.8%
ABT – 4.3%
ISRG – 5.4%
BX – 4.5%
DHI – 4.9%
DPZ – 5.5%
Friday
AXP – 4.8%
SLB – 4.0%
TRV – 4.0%
HAL – 3.5%
Intrepid option traders can leverage these expected moves to craft their trades. Bearish souls may find solace in bear call spreads beyond the anticipated range, while the bullish can explore bull put spreads or venture into the realm of naked puts for the daring. The neutral can seek refuge in the delicate dance of iron condors, with short strikes cautiously placed outside the forecasted territory.
When treading the perilous waters of earnings-driven options, prudence is paramount. Opt for risk-defined strategies, and never overextend your reach. If the script takes an unexpected twist, let not the fallout exceed a modest 1-3% impact on your portfolio.
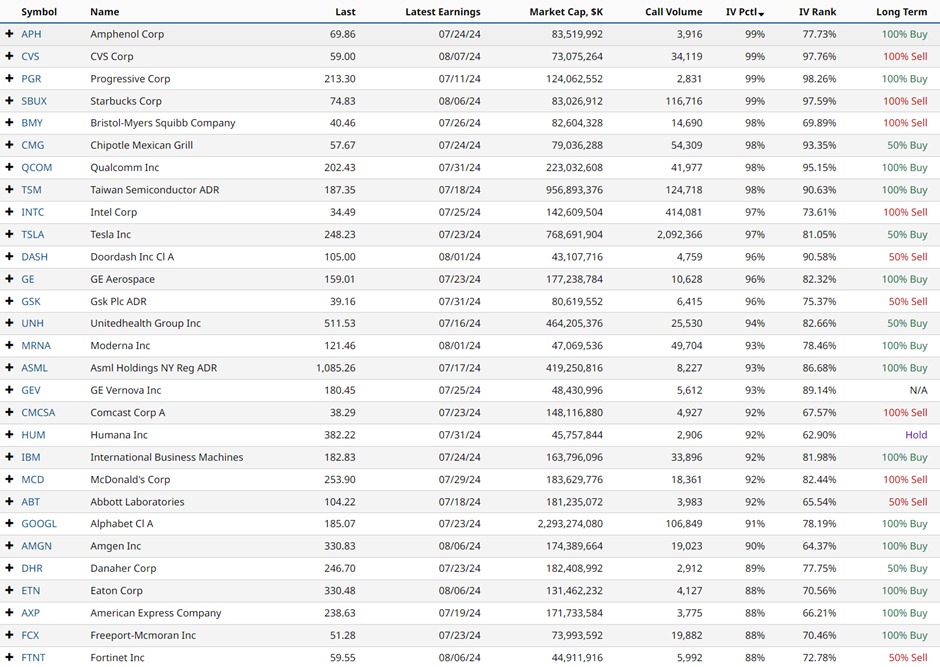
In the quest for stocks tingling with high implied volatility, Barchart’s Stock Screener emerges as a trusty ally. By filtering for a total call volume exceeding 2,000, a market cap eclipsing 40 billion, and an IV Percentile exceeding 70%, the screener unfurls a tapestry of tantalizing results, each woven by the enigmatic threads of market sentiment.
The dance of actual versus expected moves from the previous week unfolds as follows:
CAG -1.5% vs 4.5% expected
DAL -4.0% vs 6.3% expected
PEP +0.2% vs 2.6% expected
C -1.8% vs 3.5% expected
JPM -1.2% vs 3.2% expected
WFC -6.0% vs 3.9% expected
Of the 14 performances, 8 adhered to the anticipated script.
The waters of unusual options activity stirred restlessly around stocks like RIVN, RKT, KMI, AA, PFE, and TSLA last week, leaving whispers of intrigue in their wake. In the shadowy corners of the market, other stocks too danced to a peculiar tune.
An exhortation to heed the siren call of caution echoes through the market halls. Options, with their capricious nature, carry the heavy yoke of risk. This missive stands as a beacon of education, not a map for trade. Always conduct your due diligence and seek the sage counsel of your financial advisor before venturing forth into the realm of investments.
5 Stocks Our Experts Predict Could Double In the Next Year
By submitting your email, you'll also get a free pivot & flow membership. A free daily market overview. You can unsubscribe at any time.