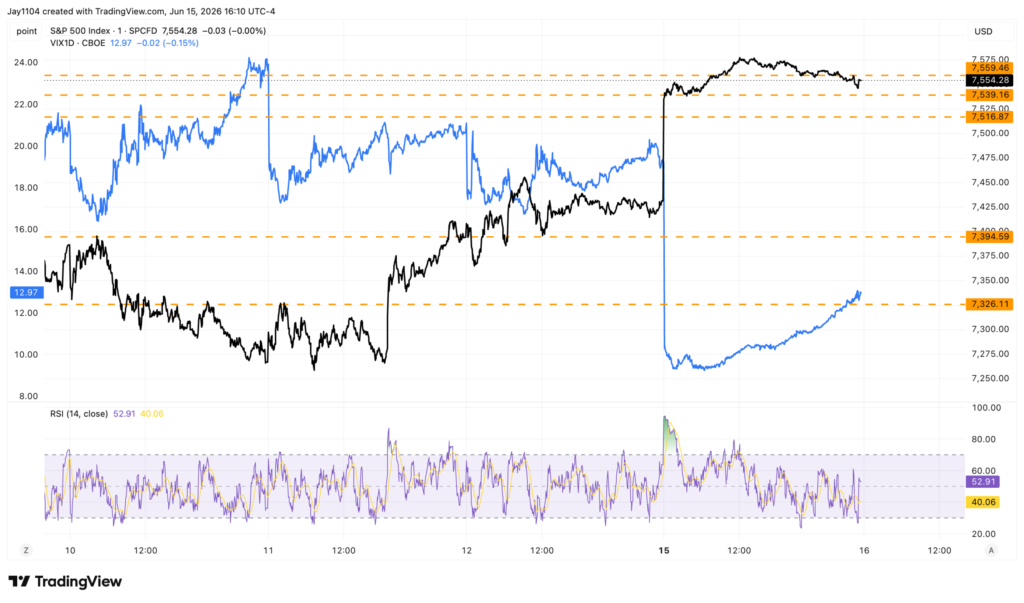
Stocks rallied sharply as volatility was crushed after news of a deal between the U.S. and Iran eased tensions in the Middle East and allowed to fall.
The , which closed around 19 on Friday, traded down to 13.5 on Monday, while the fell to 16. That was really the story of the day. Volatility has largely reset, and with much of that repricing now behind us, I would think the biggest gains in the index are likely already in the rearview mirror.
From here, the market may shift into a more grinding, range-bound move heading into OPEX on Thursday, with volatility-related tailwinds becoming less supportive after Monday’s sharp decline in implied volatility.
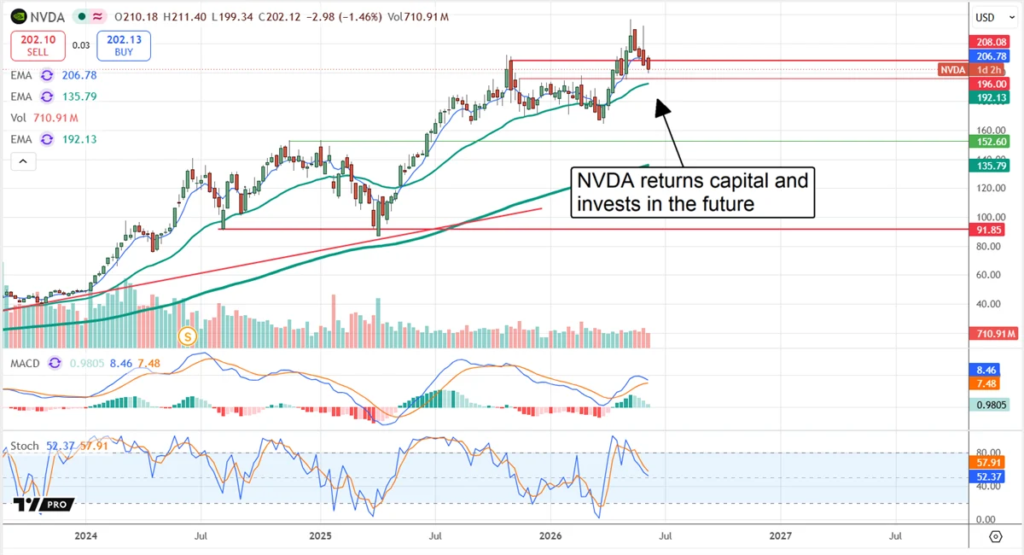
rose about 10% on the day, but more importantly, the company is set to report earnings on June 24. Seven-day implied volatility is now above 120%, an exceptionally high level that reflects elevated expectations for the report.
The stock is also heavily skewed toward call positioning, similar to what has been seen in Broadcom and other AI-related names. That suggests investors continue to lean aggressively bullish heading into earnings, which can create a setup where expectations become increasingly difficult to exceed.
The bond market saw far less excitement. In fact, the finished the day nearly 1 basis point higher at 4.98%. That may not sound like much, but the yield traded as low as 4.92% intraday, making for a fairly significant move over the course of the session.
Tonight brings the BOJ rate decision, and the market has largely priced in a rate hike from the central bank. Meanwhile, is on the verge of breaking above 160.
The BOJ will need to deliver a hawkish enough message to stabilize and strengthen the yen. Otherwise, the currency risks pushing above the highs last seen in July 2024. At this point, a rate hike alone may not be enough, as markets will likely focus more on the path of future policy tightening and whether the BOJ signals additional rate increases later this year.
The rally stalled at the 10-day exponential moving average, which has acted as resistance since mid-May. A failure to break above that moving average would likely lead to even lower gold prices.
That’s all
5 Stocks Our Experts Predict Could Double In the Next Year
By submitting your email, you'll also get a free pivot & flow membership. A free daily market overview. You can unsubscribe at any time.