Value Investing and the Importance of Diversification
Factor investing can play an important role in maintaining a well-diversified portfolio, especially in today’s market, where a relatively small group of large, growth-oriented stocks has driven much of the performance. At its core, factor investing is simply owning a basket of securities that share a common trait or factor. Common factors are things like value, momentum, quality, or low volatility. Value investing focuses on companies that are trading at lower prices relative to their fundamentals—such as earnings, sales, cash flow, or book value—with the expectation that the market will eventually recognize and reprice them more appropriately. Including this type of exposure helps balance portfolios that might otherwise be overly exposed to the elevated levels of concentration in the equity market, especially if those concentrated areas are overpriced. As we’ve started to see leadership broaden, value stocks have begun to participate more meaningfully, highlighting how diversification works in practice—when market leadership shifts, having exposure to different styles like value helps capture opportunities and smooth out returns over time.
MSCI USA Value Enhanced Value Index: A Value-Driven Comeback Story
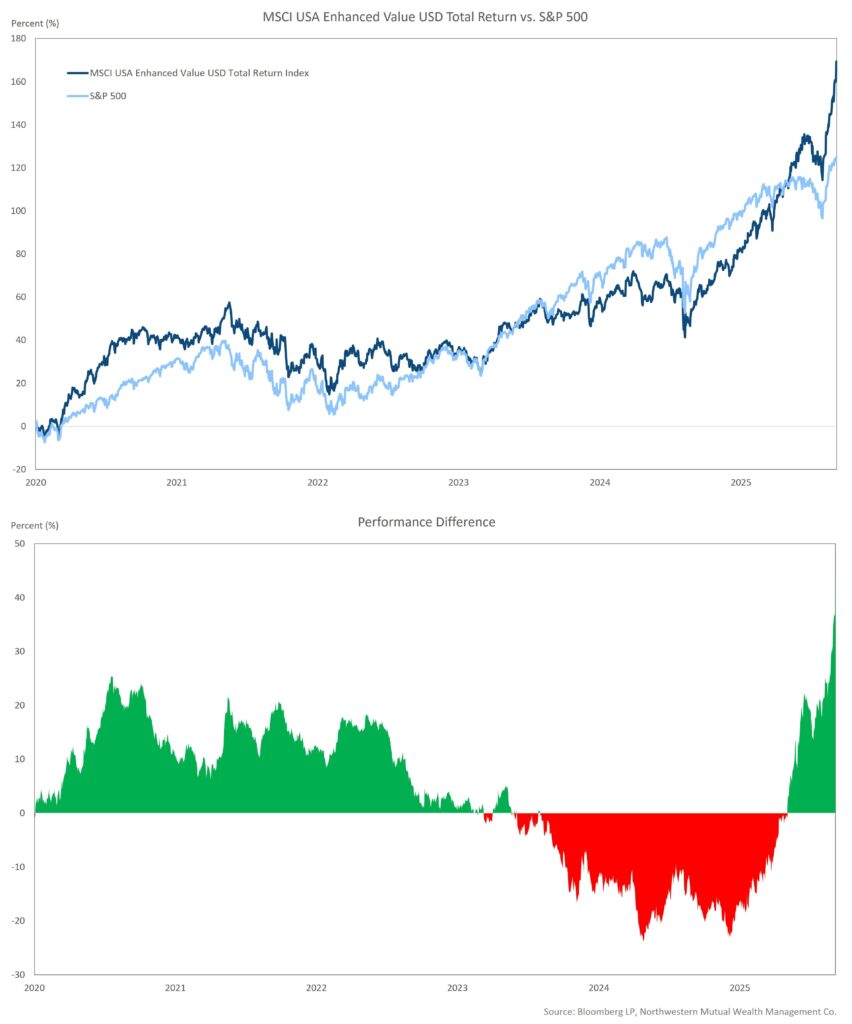
To see this principle in action, look no further than the MSCI USA Value Enhanced Value Index (M2USEV), a factor-based equity index whose recent resurgence offers a powerful lesson in how diversification can pay off in the long run. The strategy tracks Mid- to Large-Cap value U.S. companies through a systematic, sector-neutral approach. Unlike the majority of value indices, this index is sector neutral. That means its performance relative to broader indexes is driven more by stock selection than by overweighting or underweighting sectors. The methodology on which value stocks find a home in this index is based on a mosaic of financial metrics, with the common theme of owning the cheapest stocks in any given sector. The index currently tracks 149 positions. Longtime clients of our Active Passive Signature Portfolios have seen a position tracking the performance of this index in their portfolios since August 31, 2020.
At the time we observed that the value spreads were unusually wide following the pandemic. In other words, the gap between the cheapest and most expensive stocks within an industry or sector had grown significantly. Our thesis at the time was that as the economy eventually reopened and economic growth broadened, value stocks would perform well given their unusual degree of cheapness.
That view was affirmed as the COVID-19 vaccine discovery in the fall of 2020 increased investor sentiment toward a broader economic recovery. From August 31, 2020, to August 31, 2021, this value index returned 41.9 percent versus the ’s 31.2 percent return. That relative return largely persisted through the end of 2022. But then things shifted. Performance took a hit in 2023 and 2024 as the Federal Reserve’s aggressive monetary tightening policy—combined with the artificial intelligence (AI) capex boom—fueled a highly concentrated market environment. The MSCI USA Enhanced Value Index underperformed the S&P 500 by a cumulative 35 percent during those two years as less than 30 percent of the S&P 500 constituents generated performance above the aggregate index level, a significant step down from the 48 percent historical average.
Fast-forward to 2025, and the relative performance meaningfully shifted in favor of this specific value exposure. From the beginning of last year until the time of this writing (May 5, 2026), the M2USEV index is +69.9 percent versus +25.4 percent for the S&P 500. That brings the index’s total return from the inception of our position in August of 2020 to 169.3 percent versus 125.3 percent for the S&P 500, or an annualized performance of 19.1 percent compared to 15.3 percent, registering over 3.7 percent of outperformance per year relative to the S&P 500.
Performance Drivers: The Allocation Effect Versus the Selection Effect
The best way to understand the drivers of relative performance over the last year and a half is to look at an attribution report.
Because the index is sector neutral, its relative performance is driven mainly by the stock selection effect rather than sector allocation. The allocation effect measures relative sector positioning performance. Given the lack of sector overweighting and underweighting in this value index, the expectation is that this performance driver would be minimal. That assumption was confirmed over the last 17 months, as just 17 basis points of total performance have come from the allocation effect.
That leaves the selection effect as the primary driver. Stock selection effect measures how a strategy’s positions within a sector perform relative to the comparable index sector, an element that has proved incredibly strong over the past five and a half quarters. M2USEV demonstrated this positive selection effect in eight of the 11 Global Industry Classification Standard sectors, with standout performance in technology. Specifically, the technology positions in the index returned 169.3 percent versus the S&P 500 Technology sector’s 36.2 percent return. Driving that standout performance were overweight positions in (MU), (INTC), Applied Materials (AMAT), and Western Digital Corporation (WDC). Collectively, those four positions generated 33.8 percent of the index’s total outperformance, accounting for over three-quarters of the strategy’s overall alpha.
These high-performing positions share a common thread: All four companies are major players in semiconductors, with exposure to different parts of the memory and data storage supply chain. They’ve also seen their share prices surge in recent years, as supply and demand in the memory industry have shifted from a surplus to shortage, driving prices higher. Year over year, contract prices for dynamic random-access memory semiconductors have increased more than sevenfold as a result. Put simply, market conditions have recently been highly favorable for memory-chip producers.
Notable Factor Changes
The MSCI USA Enhanced Value Index’s significant recent outperformance over the S&P 500 since August 2020 has materially changed some of its factor exposures. While the intended positive value factor exposure has persisted, the index now has a positive 0.59 standard deviation exposure to momentum, meaning it leans toward assets that have recently performed well. The chart below graphically illustrates this current exposure and compares it to the time period discussed in this article (August 2020 to May 2026). The box plot shows the observed range measured in standard deviation relative to the factor exposure of the S&P 500. A number below zero indicates an exposure that’s lower than the S&P 500, while a higher number translates to a higher exposure. Take value as an example: The range over almost the last six years has been between approximately 0.9 and 1.2. This means that the value exposure of this index relative to S&P 500 has measured 0.9 to 1.2 standard deviations higher since August 2020, a fairly stable elevated exposure when compared to the S&P 500. Not every factor exposure is as stable as value. As discussed earlier, the momentum exposure has a wide observed range for this index and ended at 0.59. While that level is not above the 1.0 level that we would typically consider noteworthy, it’s materially different than the -0.5 starting level.
The Bottom Line
The recent performance comeback of this sector-neutral value index is a reminder that disciplined value factor investing requires patience, but it can reinforce the importance of a long-term perspective. Periods of sharp underperformance—often driven by narrow leadership and speculative narratives—can set the stage for powerful recoveries when fundamentals reassert themselves. The index’s recent resurgence underscores the enduring value of a sector‑neutral, valuation‑driven approach that leans on stock selection rather than sector timing to do the heavy lifting. With valuation spreads still elevated, this index may remain relevant to investors evaluating differentiated value exposure within a diversified equity portfolio.
5 Stocks Our Experts Predict Could Double In the Next Year
By submitting your email, you'll also get a free pivot & flow membership. A free daily market overview. You can unsubscribe at any time.