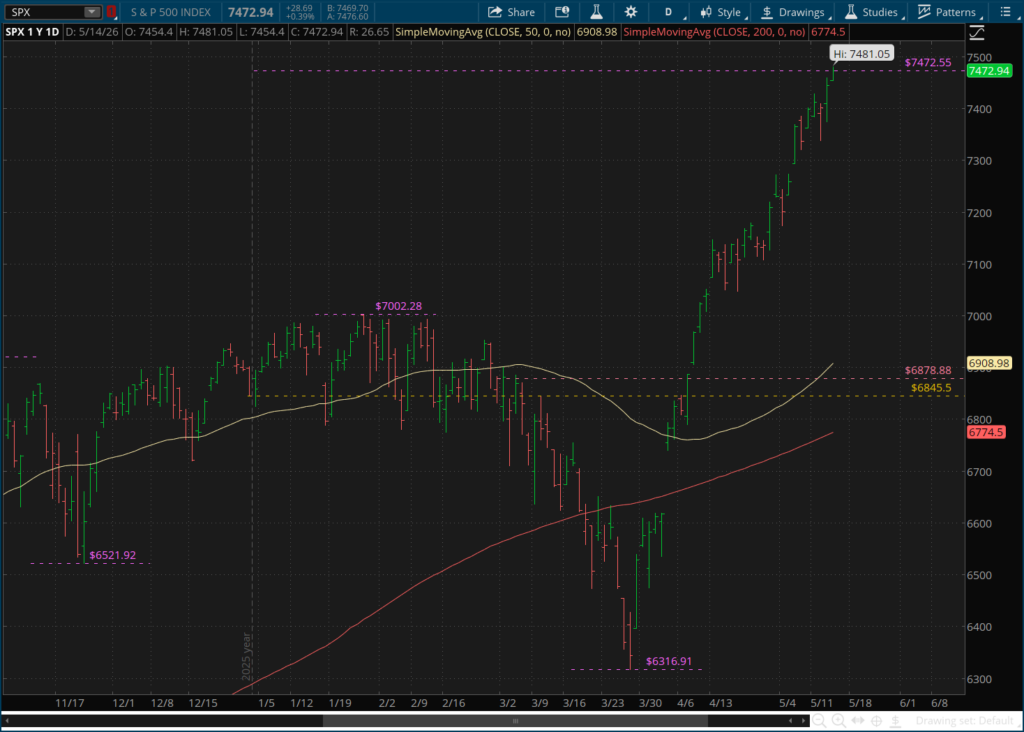
Since 1958, the first full year after the index was created, the major market average has experienced an average annual return of 9.16% not including dividends. This morning, as the S&P 500 opened higher off the back of continued strong earnings growth and the China summit, we hit that average annual return level for 2026.
The index opened up and traded to the 7472.55 level (purple horizontal line above), marking a year to date gain of said 9.16%. It’s been a tremendous rally off the late March lows, led mostly be the semiconductor stocks which have benefitted by the tremendous demand in chips.
This is made evident when we look at the , which has stalled numerous times now at the February highs. But hasn’t rolled over yet either.
The equal-weighted index had been outperforming the market-cap-weighted for most of this year. But that has now changed with this recent rally in tech.
So this begs the question, is the rally starting to lose some steam?
I would have to see more of a deterioration in the equal-weighted index before I went there. The index remains well above its 50-day average, and appears to be in a bullish flag pattern that could just as easily break out to the upside.
What I will say is that there aren’t many technical signs that the market is severely overbought, even though price has rallied hard. Only 47.4% of stocks within the index are above their 50 day averages and 55.6% of stocks are above their 200 day (chart above). This number is usually in the 70% to 80% range when important market tops are in. Although it doesn’t mean it can’t happen either.
With the bulk of Q1 earnings largely behind us, focus will likely shift back to the economy. With Q2 still looking pretty solid so far, the inflation issue could begin to sink in and spoil the party. The above chart shows the consumer price index () minus average hourly earnings from the household on a year over year basis. What we see is that earnings (up 3.6% year over year by the end of April) failed to keep up with the recent inflation spike, with CPI rising to 3.8%.
So wages have failed to keep up with the rising cost of living for the first month since the great inflation surge of 2022. This certainly bears watching because if this trend continues to worsen it will most likely have an impact on future spending.
This data is confirmed by the BEA in their monthly real personal income, which fell to its lowest levels in almost 4 years, just barely positive on a year over year basis. And bear in mind, this data point operates on a lag, so the most current data we have available is as of the end of March, while the other data point I mentioned above (average hourly earnings minus CPI) is as of the end of April.
I would assume that real personal income y/y is now in negative territory too. But we’ll find out for sure in a couple weeks.
Summary: Earnings are soaring, credit conditions are healthy, economy shows low risk of recession in the near term. Valuations are high but coming down. And to be honest, they probably should be above average given the current fundamental backdrop. Technicals still look pretty good, some cracks might be appearing, but nothing alarming just yet.
5 Stocks Our Experts Predict Could Double In the Next Year
By submitting your email, you'll also get a free pivot & flow membership. A free daily market overview. You can unsubscribe at any time.