- S&P 500 futures hit record highs despite rising oil prices and hotter inflation data.
- Technical indicators suggest markets look overbought, raising chances of short-term consolidation or pullback.
- Investors remain focused on AI optimism and potential US-China agreements supporting market sentiment.
The have risen to a new record high today, continuing to rise on the AI optimism wave and ignoring all the risks that have been thrown at the market. These include sharply rising , and two reports that came in hotter than expected. Markets wobbled only momentarily before rebounding to fresh record highs over the last couple of days. The key question now is where do we go from here?
Markets Continue to Ignore Bearish News
It is a sign of a healthy market that markets continue to rise on the back of bearish news. I also think many investors are waiting to see whether any major agreements will be announced between the US and China during Trump’s visit to China. That is keeping risk appetite supported for the time being.
However, keep an eye on oil prices, because they continue to remain on the front foot, pausing briefly before climbing again. Barring a major breakthrough in talks between the US and Iran in the coming days — which currently looks unlikely — oil prices are likely to continue rising, and that, in turn, could put pressure on risk assets.
So far, the risks have largely been contained to European markets, but Wall Street could also come under pressure if bond yields continue pushing higher from here, as a result of increased inflation expectations. Yields have risen across the curve lately, and that’s something investors should keep an eye on moving forward.
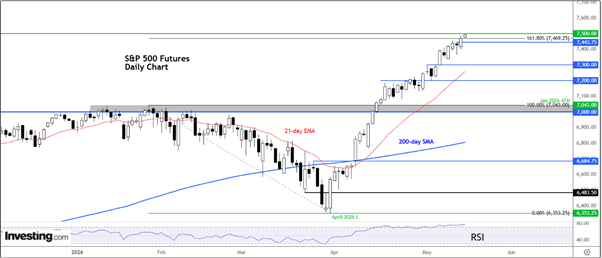
S&P 500 Technical Analysis
So, sentiment remains positive. However, from a technical point of view, the market is beginning to look a little overstretched, and the prospect of a near-term correction — or at least a pause — is something I would watch out for now after this extended run.

The index has now risen to the 161.8% Fibonacci extension level of the last major downswing that started at the end of January and ended in late March. This level comes in at 7470 on S&P 500 futures. Could we potentially see some profit-taking here?
On the downside, a couple of key levels stand out. The initial level of support to watch is around 7,443 — marking Tuesday’s high when the index printed a small hammer candle on the daily chart.
Below that, there is not a great deal of support on the daily timeframe until around 7,300, which is another level to watch.
Long-term support continues to sit around the 7,000 to 7,043 region, marking the previous all-time highs from earlier this year.
On the upside, there are currently no major technical hurdles apart from psychologically important round-number levels, such as 7,500, which traders will be watching closely for any signs of a reversal.
Meanwhile, the RSI has climbed above 76 on the daily, and above 70 on the weekly time frames. Anything above 70 is considered overbought on this indicator. The last time the index was this overbought on the weekly was at the end of September. Then, markets turned a bit choppy, leading the to the unwinding of overbought conditions.
But when markets peaked in January, the weekly RSI was already in a state of negative divergence. So, the RSI is certainly a warning sign of a possible correction but given the strength of the rally, any pullbacks we see from these record levels could be relatively small. It is very unlikely for markets to collapse all of a sudden. The rally has to weaken first, and that could take time. Any initial weakness could be mild until markets show a major reversal sign.
***
Below are the key ways an InvestingPro subscription can enhance your stock market investing performance:
- ProPicks AI: AI-managed stock picks every month, with several picks that have already taken off this month and in the long term.
- Warren AI: Investing.com’s AI tool provides real-time market insights, advanced chart analysis, and personalized trading data to help traders make quick, data-driven decisions.
- Fair Value: This feature aggregates 17 institutional-grade valuation models to cut through the noise and show you which stocks are overhyped, undervalued, or fairly priced.
-
1,200+ Financial Metrics at Your Fingertips: From debt ratios and profitability to analyst earnings revisions, you’ll have everything professional investors use to analyze stocks in one clean dashboard.
-
Institutional-Grade News & Market Insights: Stay ahead of market moves with exclusive headlines and data-driven analysis.
-
A Distraction-Free Research Experience: No pop-ups. No clutter. No ads. Just streamlined tools built for smart decision-making.
-
Vision AI: InvestingPro’s newest addition. It analyzes any asset’s chart with professional-grade market intelligence, identifying key timeframes, technical patterns, and indicators — then delivers a clear trading playbook with the levels, scenarios, and risks that matter most in under a minute.
Not a Pro member yet?
Disclaimer: This article is written for informational purposes only; it does not constitute a solicitation, offer, advice, counsel or recommendation to invest as such it is not intended to incentivize the purchase of assets in any way. I would like to remind you that any type of asset, is evaluated from multiple perspectives and is highly risky and therefore, any investment decision and the associated risk remains with the investor.
5 Stocks Our Experts Predict Could Double In the Next Year
By submitting your email, you'll also get a free pivot & flow membership. A free daily market overview. You can unsubscribe at any time.