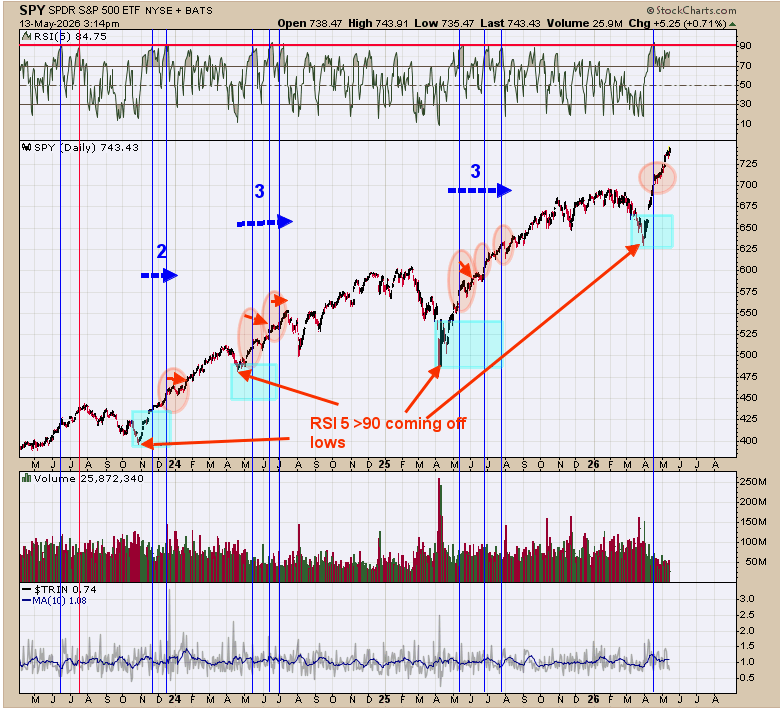
We are presenting this chart again as its relevant on the current rally. The top window is the RSI five periods next lower window is the daily . It’s a bullish sign for the market coming off lows when the RSI (5) reaches +90 (current reading is 84.75). This condition suggests there is strong momentum in the market and higher prices are expected. We shaded in green the previous lows in the SPY and marked with blue lines when the RSI (5) reached +90.
")
Over the last 3 years and the last three bottoms in the market the RSI (5) reached +90 at least twice. The current setup there is just one RSI (5) so far but another one may be seen shortly. These RSI (5) +90 readings suggest the rally is the halfway point of the move higher.
")
RSI (14) may get to 80 on this run and open the door for higher prices. Current RSI reading is 76.85. Yesterday’s commentary still applies, “Top window is the RSI 14 period going back to 2002. We noted the times when the RSI (14) reached 80 with blue dotted lines. An RSI of 80 suggests the market has strong momentum and never the last high in the market. The RSI reached 80, eight times since 2002 (once every 3 years) and is a rare occurrence. Current RSI reading stands at 76.52, only 3 ½ points away of reaching 80. The reason we pointed out the RSI reading near 80 is that it has marked the halfway point of the move up in the past. If indeed the RSI does reach 80 in the near future than we can project a price target to where the market is heading on this run. We will keep watch on this chart going forward.”
")
Yesterday we presented the long term view using the monthly RSI for the / ratio. When the monthly RSI of the HUI/Gold ratio is above 50, HUI is considered in an uptrend and when below 50 a downtrend; currently the monthly RSI is above 50 suggesting the longer term trend in HUI (, ) is up. Above is an intermediate term view for GDX (which can be down even though the long term is up). Second window up from the bottom is the daily cumulative advance/decline and next higher window is the daily cumulative up down volume (both for GDX). When both indicators are above their mid Bollinger bands the intermediate term trend is up (shaded in green) and when both indicators are below their mid Bollinger bands the intermediate term trend is down (shaded in pink). Even though the intermediate term trend is down (we think more sideways) we are taking the longer term view which is bullish
5 Stocks Our Experts Predict Could Double In the Next Year
By submitting your email, you'll also get a free pivot & flow membership. A free daily market overview. You can unsubscribe at any time.