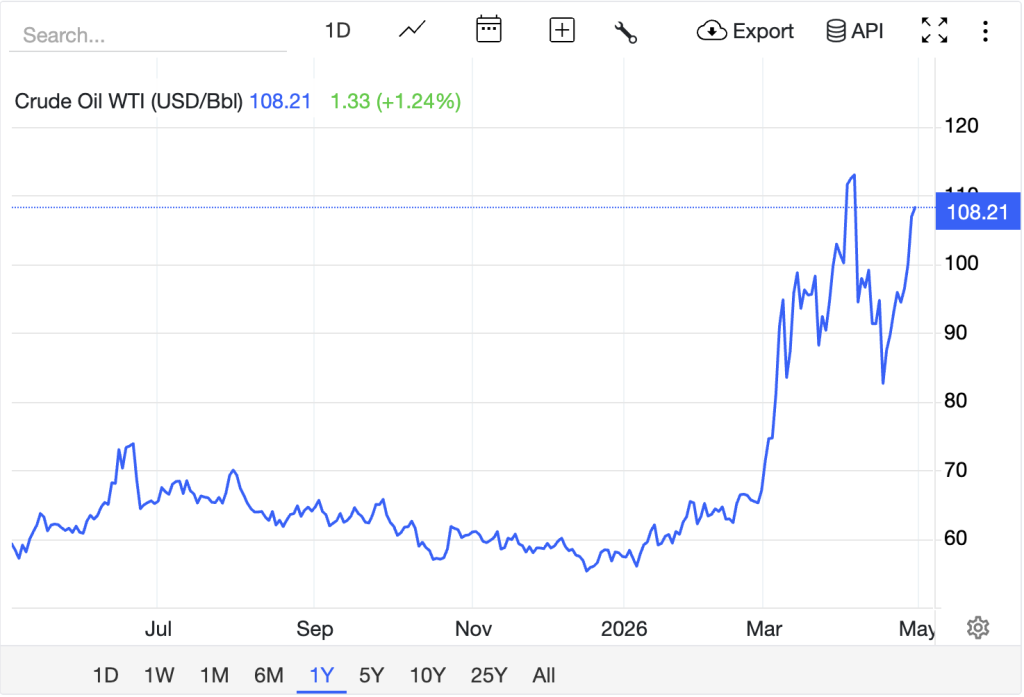
prices have surged, with June Brent delivery reaching $126.41 per barrel and June WTI at $110.31, following President Trump’s indication that the U.S. naval blockade on Iranian oil exports may continue for months.
This situation is driving oil prices to their highest levels in over 4 years and significantly impacting the global energy market. The US Central Command has intercepted 42 commercial vessels attempting to breach the blockade, leaving 41 tankers with about 69 million barrels of oil stranded.
Energy stocks like Exxon Mobil (NYSE:) and Chevron (NYSE:) are sharply rising as free cash flow projections improve with higher oil prices. The Energy Select Sector SPDR ETF (NYSE:) is also outperforming the broader .
The following sections will delve into the geopolitical aspects of the blockade, the financial benefits for US producers, the implications for income investors, and the stock performance of the sector’s largest companies.
SOURCE: TradingEconomics
Tehran’s Chokepoint: Trump’s Prolonged Blockade and Effect on Oil Prices
Trump’s indication that the Iran blockade could last for months, seen as more effective than air strikes, has led to a geopolitical risk premium.
Analysts at Eurasia Group predict that transport volumes through the Strait of Hormuz, a vital chokepoint for one-fifth of the world’s oil supply, will remain below 10% of prewar levels, keeping upward pressure on oil prices.
Iran has threatened to tighten control over the waterway if the blockade continues, complicating stalled diplomatic efforts.
Goldman Sachs and Morgan Stanley project that a sustained blockade could remove up to 1.5 million barrels per day of Iranian oil from the global market, raising year-end WTI targets to $85, figures that seem conservative given that WTI is already over $110.
The head of the International Energy Agency described the crisis as worse than the oil shocks of the 1970s and 2022 combined, evidenced by a 48% increase in Brent crude prices since February 2026.
European markets have factored in a substantial war premium, and unless the blockade is lifted, the supply situation appears dire.

Domestic Producer Windfall: How $110 WTI Crude Reprices Energy Sector Free Cash Flow
At $110.31 WTI crude, U.S. onshore producers have wide profit margins, with Permian Basin break-even costs ranging from $35 to $50 per barrel, Bakken around $40 to $55, and Eagle Ford similar.
This results in per-barrel margins of $55 to $75. For ExxonMobil, the increase from $80 to $110 WTI translates to roughly $12Bn in additional annual free cash flow, significantly affecting its capital return strategy.
Chevron sees a comparable increase of about $9Bn in free cash flow at current prices. CEO Mike Wirth has warned that underinvestment has depleted global spare production capacity, limiting the market’s ability to cover supply losses.
The XLE ETF, with XOM and CVX as top holdings, has notably outperformed the S&P 500 as oil prices rise above $100 per barrel.
Dividend Yields and Capital Return Acceleration: Whether $110 Oil Prices Repeat the 2022 Playbook
The 2022 analog is pertinent: when Brent crude averaged over $100, ExxonMobil and Chevron increased buybacks and dividends, resulting in strong shareholder returns.
Currently, ExxonMobil has a 3.2% dividend yield and a $20Bn share repurchase plan, while Chevron, with 37 years of dividend increases, raised its quarterly dividend by 8% to $1.63 per share, yielding about 4.0%.
The key question for income investors is whether the cash flow from $110 WTI will sustain or accelerate these capital return programs.
Both companies generate significant excess cash at over $55 per barrel, covering capital, dividends, and growth budgets. However, rising long-term rates could affect their valuation relative to Treasuries.
The income potential remains strong if prices stay above $90. A risk to this outlook is geopolitical developments; any resolution that returns Iranian oil could quickly compress margins, making diplomatic solutions a critical factor for energy investors to watch.
XOM and CVX Stock Brief: Current Price Action and Key Metrics

SOURCE: Yahoo Finance
As for oil prices, at the time of writing, ExxonMobil was trading at $154.67, up 1.8%, near multi-year highs with a 52-week range of $95 to $170. It has a trailing P/E in the mid-teens, a market cap of over $642Bn, and a consensus of Buy from analysts with price targets between $160 and $170. The company also announced a $20Bn buyback and offers a 3.2% dividend yield, appealing to retail investors amid rising WTI crude prices.
Chevron was at $162.10, up 1.5%, with a 52-week range of $130 to $170 and a market cap near $300Bn. Its forward P/E is in the low double digits, and it boasts a 37-year dividend growth streak with a recent quarterly increase to $1.63 per share, making it attractive to income investors.
Occidental Petroleum (NYSE:) gained 2.4% due to its sensitivity to WTI crude prices. The UN Development Program warns that rising energy costs could push millions into poverty, highlighting that the stakes extend beyond equity markets. However, major US energy stocks are benefiting from strong cash flow dynamics not seen since 2022.
***
Looking to start your trading day ahead of the curve?
Get up to speed before the bell with Bull Whisper—a sharp, daily premarket newsletter packed with key news, market-moving updates, and actionable insights for traders.
Start your day with an edge. Subscribe to Bull Whisper using this link.
5 Stocks Our Experts Predict Could Double In the Next Year
By submitting your email, you'll also get a free pivot & flow membership. A free daily market overview. You can unsubscribe at any time.